
Figure 2.
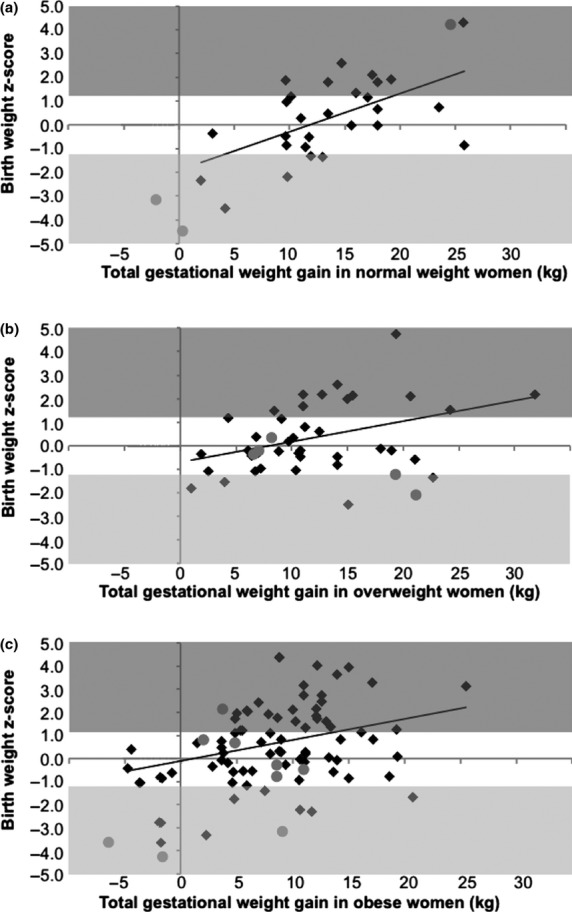
Infant birth weight z-score in relation to gestational weight gain in (a) women of normal weight, (b) overweight women and (c) obese women with Type 2 diabetes. Grey areas represent large- or small-for-gestational-age infants. The best fitted lines are depicted with β = 0.58, P = 0.001, β = 0.39, P = 0.012 and β = 0.32, P = 0.005, respectively. Grey circles, women delivered preterm; black diamonds, women delivered at term.