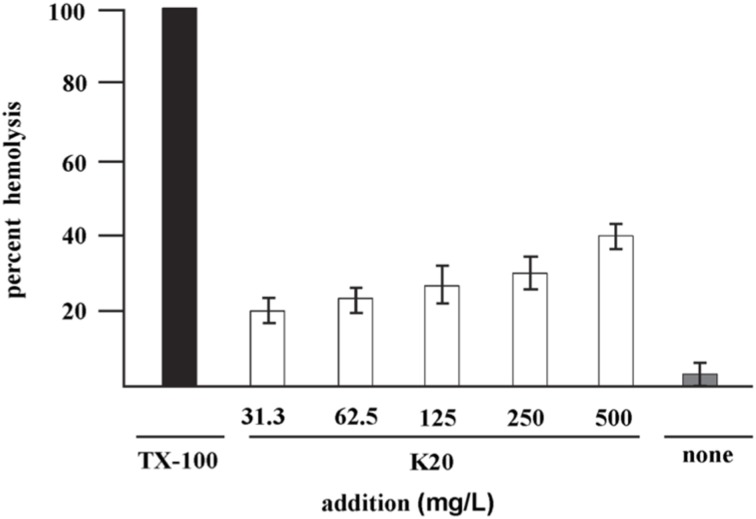
Figure 4.
Hemolysis of sheep erythrocytes with various concentrations of K20 after 1 h exposure at 37°C (white bars). Controls were exposure to Triton X-100® (1%, vol/vol) giving 100% hemolysis (black bar) and no exposure to K20 (gray bar). The HC50 value is >500 mg/L. Standard deviation was used as the statistical parameter.

