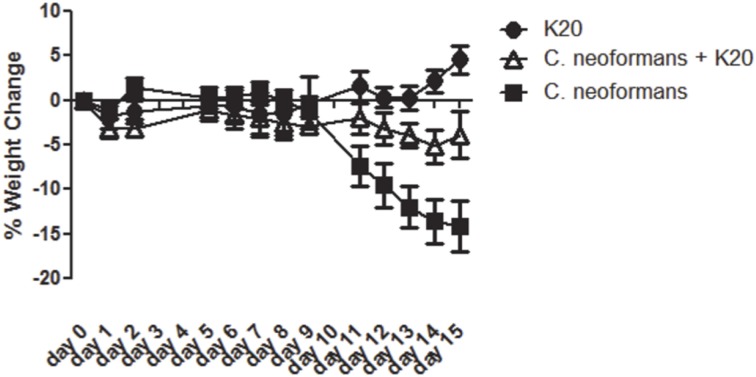
Figure 9.
Mean percent body weight change in groups of mice receiving treatments of K20. Treatments with K20 were one dose/animal of 100 μL of 200 mg/L K20 (filled circles), infected with one dose/animal of 100 μL of C. neoformans H99 (5 × 10³ cells/mL) mixed with K20 (200 mg/L) (open triangles), and infected with 1 dose/animal of 100 μL C. neoformans H99 (5 × 10³ cells/mL) only (filled squares). Data were statistically analyzed and P-values determined by One-Way ANOVA methods.

