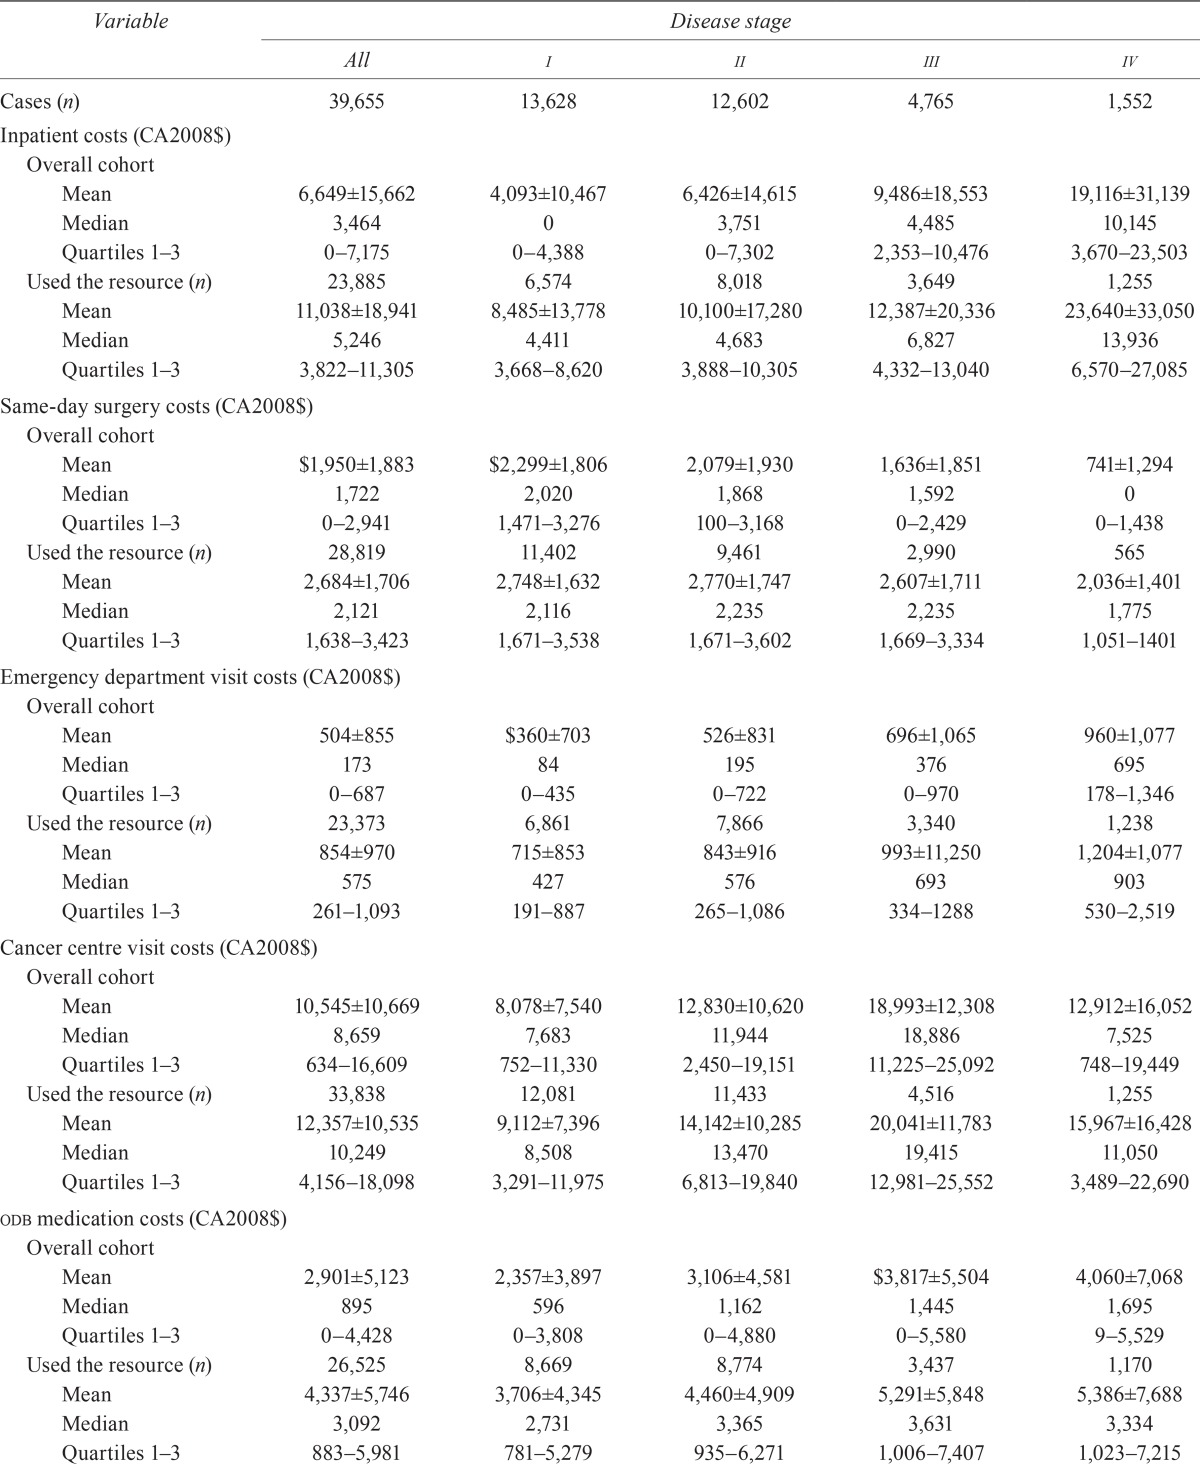
TABLE IV.
Health care resource-specific costs (total cohort and those who used the resource)


| Variable | Disease stage | ||||
|---|---|---|---|---|---|
|
| |||||
| All | i | ii | iii | iv | |
| Cases (n) | 39,655 | 13,628 | 12,602 | 4,765 | 1,552 |
| Inpatient costs (CA2008$) | |||||
| Overall cohort | |||||
| Mean | 6,649±15,662 | 4,093±10,467 | 6,426±14,615 | 9,486±18,553 | 19,116±31,139 |
| Median | 3,464 | 0 | 3,751 | 4,485 | 10,145 |
| Quartiles 1–3 | 0–7,175 | 0–4,388 | 0–7,302 | 2,353–10,476 | 3,670–23,503 |
| Used the resource (n) | 23,885 | 6,574 | 8,018 | 3,649 | 1,255 |
| Mean | 11,038±18,941 | 8,485±13,778 | 10,100±17,280 | 12,387±20,336 | 23,640±33,050 |
| Median | 5,246 | 4,411 | 4,683 | 6,827 | 13,936 |
| Quartiles 1–3 | 3,822–11,305 | 3,668–8,620 | 3,888–10,305 | 4,332–13,040 | 6,570–27,085 |
| Same-day surgery costs (CA2008$) | |||||
| Overall cohort | |||||
| Mean | $1,950±1,883 | $2,299±1,806 | 2,079±1,930 | 1,636±1,851 | 741±1,294 |
| Median | 1,722 | 2,020 | 1,868 | 1,592 | 0 |
| Quartiles 1–3 | 0–2,941 | 1,471–3,276 | 100–3,168 | 0–2,429 | 0–1,438 |
| Used the resource (n) | 28,819 | 11,402 | 9,461 | 2,990 | 565 |
| Mean | 2,684±1,706 | 2,748±1,632 | 2,770±1,747 | 2,607±1,711 | 2,036±1,401 |
| Median | 2,121 | 2,116 | 2,235 | 2,235 | 1,775 |
| Quartiles 1–3 | 1,638–3,423 | 1,671–3,538 | 1,671–3,602 | 1,669–3,334 | 1,051–1401 |
| Emergency department visit costs (CA2008$) | |||||
| Overall cohort | |||||
| Mean | 504±855 | $360±703 | 526±831 | 696±1,065 | 960±1,077 |
| Median | 173 | 84 | 195 | 376 | 695 |
| Quartiles 1–3 | 0–687 | 0–435 | 0–722 | 0–970 | 178–1,346 |
| Used the resource (n) | 23,373 | 6,861 | 7,866 | 3,340 | 1,238 |
| Mean | 854±970 | 715±853 | 843±916 | 993±11,250 | 1,204±1,077 |
| Median | 575 | 427 | 576 | 693 | 903 |
| Quartiles 1–3 | 261–1,093 | 191–887 | 265–1,086 | 334–1288 | 530–2,519 |
| Cancer centre visit costs (CA2008$) | |||||
| Overall cohort | |||||
| Mean | 10,545±10,669 | 8,078±7,540 | 12,830±10,620 | 18,993±12,308 | 12,912±16,052 |
| Median | 8,659 | 7,683 | 11,944 | 18,886 | 7,525 |
| Quartiles 1–3 | 634–16,609 | 752–11,330 | 2,450–19,151 | 11,225–25,092 | 748–19,449 |
| Used the resource (n) | 33,838 | 12,081 | 11,433 | 4,516 | 1,255 |
| Mean | 12,357±10,535 | 9,112±7,396 | 14,142±10,285 | 20,041±11,783 | 15,967±16,428 |
| Median | 10,249 | 8,508 | 13,470 | 19,415 | 11,050 |
| Quartiles 1–3 | 4,156–18,098 | 3,291–11,975 | 6,813–19,840 | 12,981–25,552 | 3,489–22,690 |
| odb medication costs (CA2008$) | |||||
| Overall cohort | |||||
| Mean | 2,901±5,123 | 2,357±3,897 | 3,106±4,581 | $3,817±5,504 | 4,060±7,068 |
| Median | 895 | 596 | 1,162 | 1,445 | 1,695 |
| Quartiles 1–3 | 0–4,428 | 0–3,808 | 0–4,880 | 0–5,580 | 9–5,529 |
| Used the resource (n) | 26,525 | 8,669 | 8,774 | 3,437 | 1,170 |
| Mean | 4,337±5,746 | 3,706±4,345 | 4,460±4,909 | 5,291±5,848 | 5,386±7,688 |
| Median | 3,092 | 2,731 | 3,365 | 3,631 | 3,334 |
| Quartiles 1–3 | 883–5,981 | 781–5,279 | 935–6,271 | 1,006–7,407 | 1,023–7,215 |
| Costs of cancer medications and chemotherapies (CA2008$) | |||||
| Overall cohort | |||||
| Mean | 278±650 | 147±3,694 | 360±687 | 577±850 | 451±965 |
| Median | 0 | 0 | 61 | 248 | 0 |
| Quartiles 1–3 | 0–232 | 0–0 | 0–296 | 27–412 | 0–339 |
| Used the resource (n) | 16,964 | 2,874 | 7,720 | 3,712 | 741 |
| Mean | 15,342±20,686 | 15,622±20,894 | 14,204±19,409 | 17,484±21,718 | 19,036±27,466 |
| Median | 6,434 | 5,874 | 6,498 | 7,193 | 6,208 |
| Quartiles 1–3 | 2,875–11,094 | 1,204–28,643 | 3,300–8,947 | 4,116–25,478 | 1,040–24,104 |
| Complex continuing care costs (CA2008$) | |||||
| Overall cohort | |||||
| Mean | 542±7,592 | 174±3,694 | 462±6,942 | 784±9,991 | 2,131±12,032 |
| Median | 0 | 0 | 0 | 0 | 0 |
| Quartiles 1–3 | 0–0 | 0–0 | 0–0 | 0–0 | 0–0 |
| Used the resource (n) | 759 | 76 | 182 | 133 | 153 |
| Mean | 28,314±47,201 | 26,333±42,192 | 32,010±48,369 | 28,071±53,204 | 21,817±32,454 |
| Median | 11,974 | 14,337 | 14,560 | 11,908 | 10,730 |
| Quartiles 1–3 | 5,162–30,637 | 6230–24248 | 5,329–41,838 | 4611–32,344 | 5,072–22,834 |
| Long-term care costs (CA2008$) | |||||
| Overall cohort | |||||
| Mean | 1,071±7,650 | 474±5,202 | 938±7,334 | 977±7,192 | 1,005±6,828 |
| Median | 0 | 0 | 0 | 0 | 0 |
| Quartiles 1–3 | 0–0 | 0–0 | 0–0 | 0–0 | 0–0 |
| Used the resource (n) | 1,177 | 163 | 307 | 139 | 498 |
| Mean | 36,068±26,642 | 39,659±26,702 | 38,520±27,613 | 33,503±26,230 | 36,034±25,912 |
| Median | 34,397 | 37,001 | 36,951 | 24,865 | 36,461 |
| Quartiles 1–3 | 9,375–63,385 | 17,562–64,606 | 11,430–65,185 | 9,808–58,187 | 9,466–65,005 |
| Radiation therapist costs (CA2008$) | |||||
| Overall cohort | |||||
| Mean | 420±409 | 392±323 | 461±414 | 743±474 | 245±387 |
| Median | 400 | 398 | 446 | 738 | 68 |
| Quartiles 1–3 | 0–683 | 0–602 | 0–732 | 485–1,043 | 0–342 |
| Used the resource (n) | 25,793 | 9,751 | 8,601 | 4,057 | 815 |
| Mean | 646±333 | 548±245 | 675±326 | 873±388 | 466±246 |
| Median | 593 | 495 | 621 | 1,019 | 328 |
| Quartiles 1–3 | 413–817 | 374–704 | 436–852 | 625–1,117 | 160–661 |
| Total ohip costs (CA2008$)a | |||||
| Overall cohort | |||||
| Mean | 7,266±4,975 | 6,486±4,179 | 7,786±3,951 | 9,404±6,136 | 9,359±8,591 |
| Median | 6,382 | 5,713 | 7,005 | 8,542 | 8,012 |
| Quartiles 1–3 | 4,693–8,842 | 4,466–7,579 | 5,351–9,320 | 6,462–11,233 | 4,621–12,098 |
| Used the resource (n) | 39,601 | 13,627 | 12,598 | 4,763 | 1,550 |
| Mean | 7,276±4,971 | 6,487±4,178 | 7,788±3,949 | 9,408±6,135 | 9,371±8,590 |
| Median | 6,386 | 5,713 | 7,006 | 8,434 | 7,924 |
| Quartiles 1–3 | 4,701–8,846 | 4,466–7,580 | 5,352–9,320 | 6,546–11,233 | 4,480–12,078 |
| Home care costs (CA2008$) | |||||
| Overall cohort | |||||
| Mean | 2,538±4,824 | 1,436±3,264 | 2,782±4,358 | 4,287±5,793 | 5,726±9,306 |
| Median | 1,237 | 691 | 1,583 | 2,516 | 2,273 |
| Quartiles 1–3 | 0–2,753 | 0–1,555 | 794–3,212 | 1,339–5,015 | 584–6,484 |
| Used the resource (n) | 29,559 | 8,415 | 10,759 | 4,520 | 1,232 |
| Mean | 3,405±5,316 | 2,325±3,897 | 3,259±4,549 | 4,519±5,859 | 7,213±9,918 |
| Median | 1,771 | 1,294 | 1,902 | 2,690 | 3,579 |
| Quartiles 1–3 | 1,035–3,675 | 822–2,397 | 1,146–3,674 | 1,489–5,255 | 1,497–8,948 |
| Other costs (CA2008$)b | |||||
| Overall cohort | |||||
| Mean | 738±7,762 | 522±7,032 | 799±8,109 | 921±9,424 | 1,285±7,197 |
| Median | 0 | 0 | 0 | 0 | 0 |
| Quartiles 1–3 | 0–0 | 0–0 | 0–0 | 0–0 | 0–0 |
| Used the resource (n) | 4,778 | 988 | 1,473 | 801 | 246 |
| Mean | 6,128±21,613 | 7,194±25,191 | 6,833±22,839 | 5,478±22,448 | 8,107±16,453 |
| Median | 332 | 380 | 369 | 313 | 1,145 |
| Quartiles 1–3 | 222–1,498 | 222–2,918 | 222–1,637 | 222–993 | 382–5,350 |
Includes physician billings, family health network or family health organization capitation, and non-physician and diagnostic or laboratory (physician component) costs.
Includes dialysis, rehabilitation, mental health hospitalization, and the Assistive Devices Program.
odb = Ontario Drug Benefit; ohip = Ontario Health Insurance Program.
