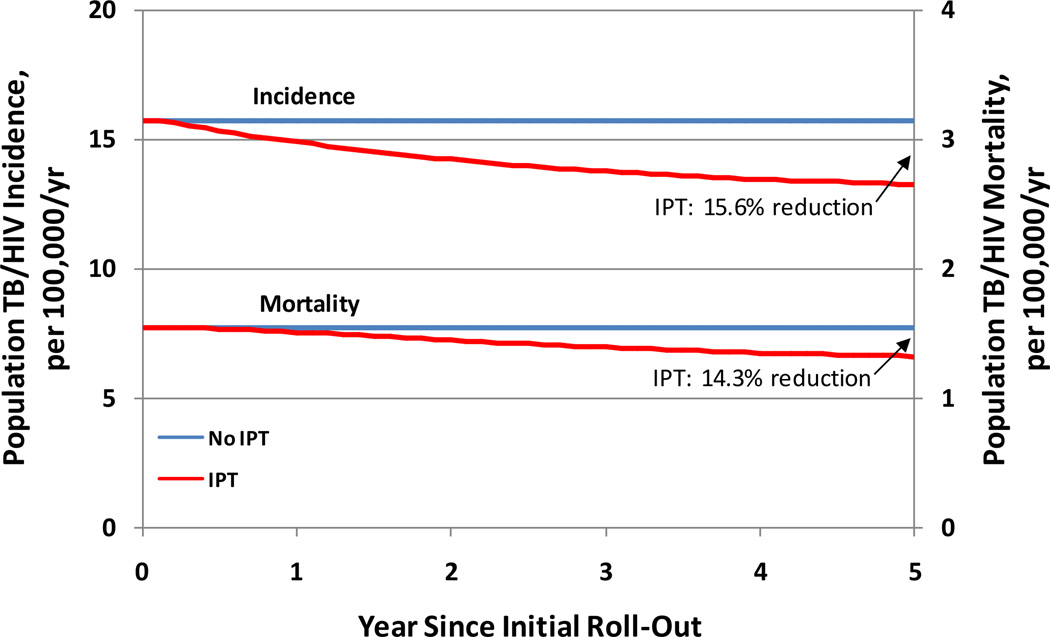
Figure 3. Five-Year Impact of Isoniazid Preventive Therapy on HIV-Associated TB in Rio de Janeiro, Brazil.
Blue lines show the baseline (steady-state) scenario, while red lines show the projected TB incidence and mortality as a function of time after rolling out a program for isoniazid preventive therapy (IPT) capable of providing IPT to 20% of the eligible HIV-infected population per year. The upper set of lines and leftward axis display TB incidence, whereas the lower set of lines and the rightward axis display TB mortality.

