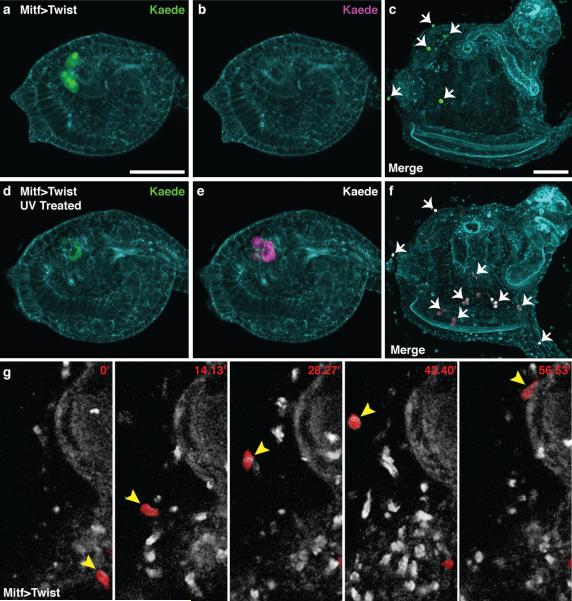
Figure 4. Lineage tracing of reprogrammed a9.49 cells.
a-f, Ciona electroporated with Mitf>Twist and Tyr>Kaede. a,b, Non-UV treated tailbud shows only green fluorescence c, Embryo never exposed to UV results in a juvenile with only green ectopic cells (arrows). d,e, UV treated tailbud shows green and red fluorescence respectively. f, UV treated embryo results in a juvenile with green and red ectopic cells (arrows). g, Time-lapse frames of Supplemental Movie 2 (minutes indicated) shows the migration of reprogrammed a9.49 cell labeled with Tyr>mCherry (arrowhead). Scale bars, 50 μm.

