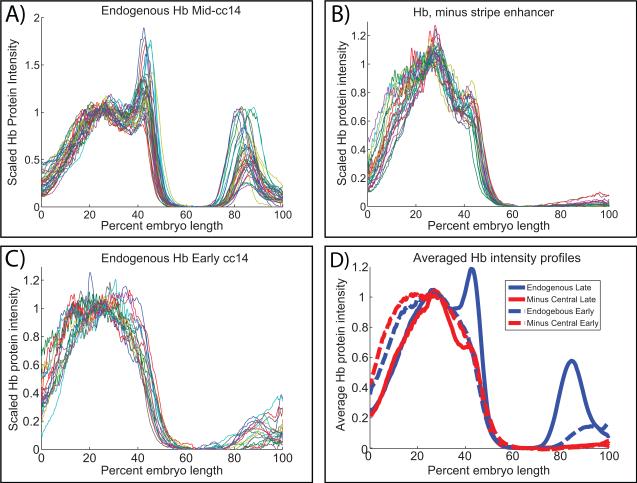
Fig. 3. Quantitative analysis of Hb expression profiles.
Profile of Hb protein late for 31 wild type embryos (A) and for 23 transgenic recue embryos lacking the stripe enhancer (B). The average position of the Hb boundary (as defined by the %EL at which the Hb instensity reaches 0.5) in endogenous embryos is 47.2 % EL. In the minus stripe enhancer constructs the average position of the boundary is shifted anteriorly to 45.6% EL. In both cases the Hb profile sharpens during cc 14 (C). Removal of the stripe enhancer significantly affects the boundary region, as shown by comparing the average Hb profile for endogenous and the rescue constructs (D). A small amount of residual expression remains in central regions in some embryos. This expression may result from an incompletely knocked-out stripe enhancer, but more likely comes from a small amount of activation from the shadow enhancer, which drives some expression in this region in the enhancer->lacZ embryos (and which rapidly disappears).

