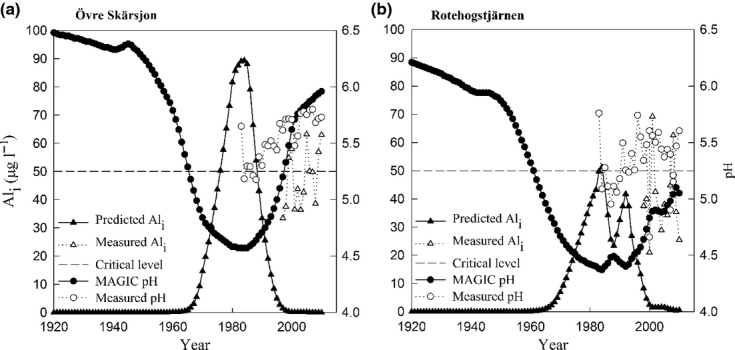
Fig 6.

Reconstructed (▴) and measured (Δ) Ali μg L−1 on the left axis and reconstructed (●) and measured (◯) pH on the right axis by year. Two lakes with different classifications (a) Övre Skärsjön were both methods agree and (b) Rotehogstjärnen were MAGIC-predicted acidification but roach is present. The dashed horizontal line is the critical level of 50 μg L−1 for roach mortality and reproduction failure.
