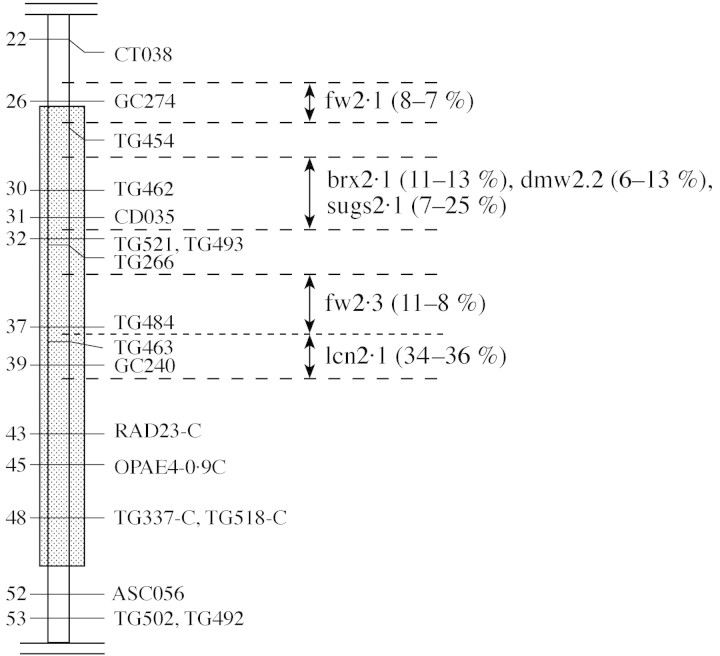
Fig. 1. Map of the region of chromosome 2 where the CF12-C and CF14-L near-isogenic lines differ (hatched). Distances on the left of the chromosome are centimorgans from the top of the chromosome. The four intervals where QTLs were finely located are indicated on the right, with their codes (fw, fruit weight; brx, soluble solid content; sugs and dmw, reducing sugars and dry matter content; lcn, locular number). The effects of the QTLs, expressed as percentage of average difference, detected in two glasshouse trials, are in parentheses (adapted from Lecomte et al., 2003).

An official website of the United States government
Here's how you know
Official websites use .gov
A
.gov website belongs to an official
government organization in the United States.
Secure .gov websites use HTTPS
A lock (
) or https:// means you've safely
connected to the .gov website. Share sensitive
information only on official, secure websites.
