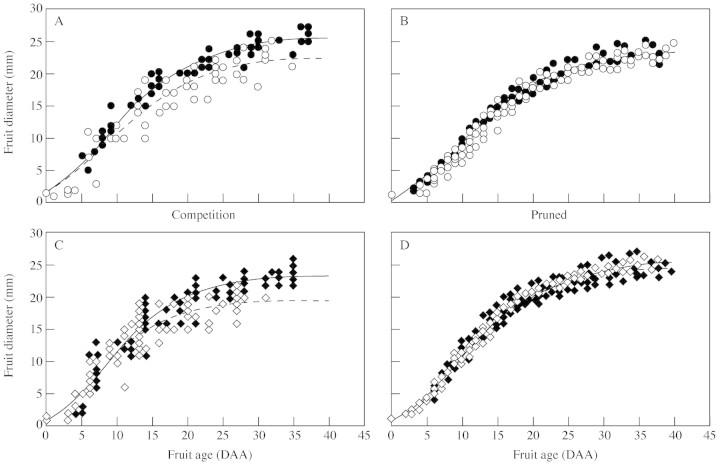
Fig. 3. Growth curves of basal (filled symbols) and tip (open symbols) fruits measured in the competition (A and C) and pruned (B and D) experiments for the CF14-L (A and B) and CF12-C line (C and D). Individual points are experimental data measured on 12 different fruits for each treatment. Full and broken lines represent the non-linear adjustment of a three-parameter Gompertz function for basal and tip fruits, respectively (R2 > 0·98 in all cases; standard error of estimate = 0·6–1·12).

An official website of the United States government
Here's how you know
Official websites use .gov
A
.gov website belongs to an official
government organization in the United States.
Secure .gov websites use HTTPS
A lock (
) or https:// means you've safely
connected to the .gov website. Share sensitive
information only on official, secure websites.
