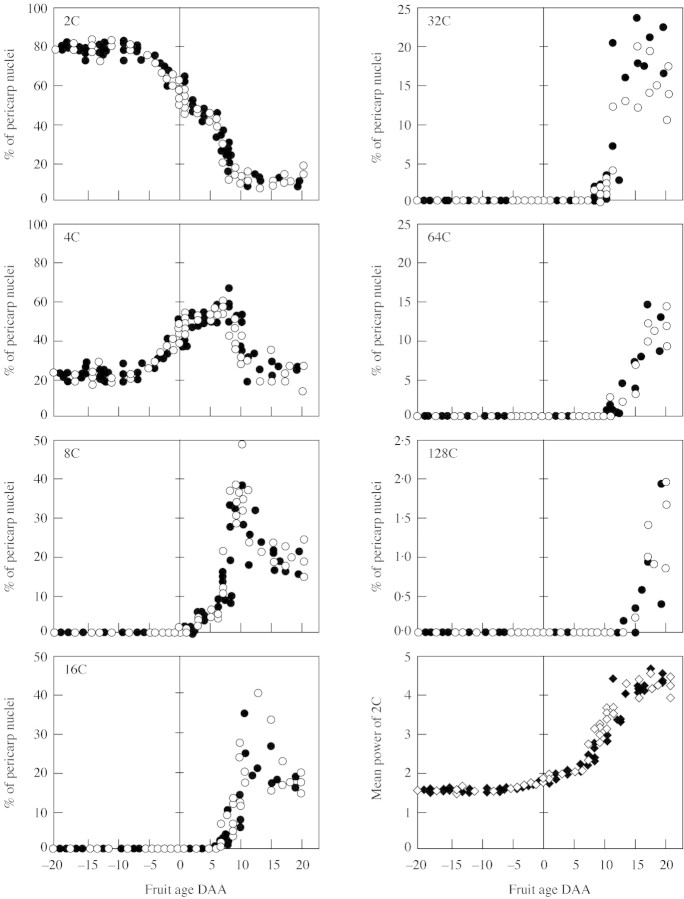
Fig. 5. Change during ovary and fruit development of the percentages of pericarp nuclei distributed according to their DNA content from 2C to 128C. The last figure represents the change of n, the mean power of 2Cn DNA amount. Filled and open symbols represent, respectively, the CF14-L and CF12-C tomato lines. Each point is an individual fruit of the pruned experiment.

An official website of the United States government
Here's how you know
Official websites use .gov
A
.gov website belongs to an official
government organization in the United States.
Secure .gov websites use HTTPS
A lock (
) or https:// means you've safely
connected to the .gov website. Share sensitive
information only on official, secure websites.
