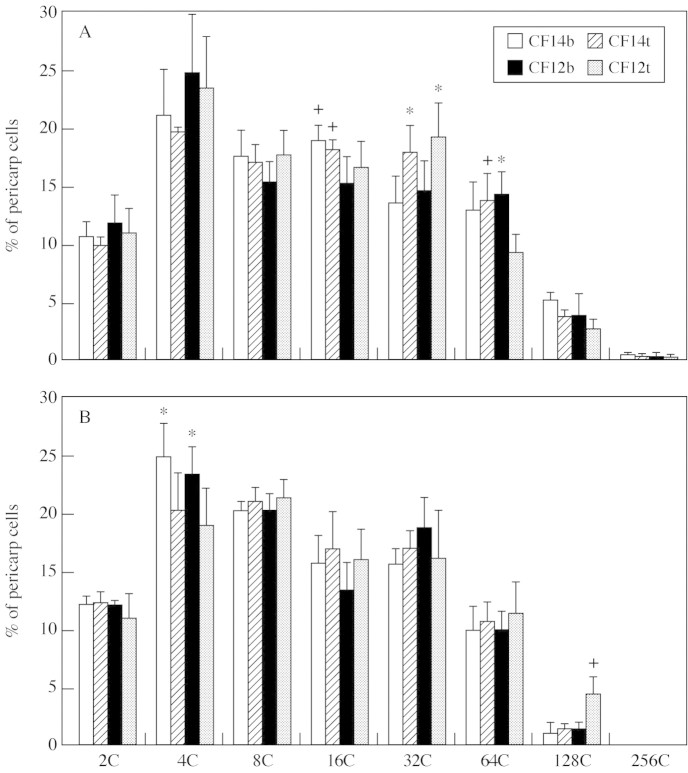
Fig. 6. Distribution of pericarp nuclei according to their DNA content from 2C to 256C in competition (A) and pruned (B) experiments at basal (CF14b, CF12b) and tip fruit positions (CF14t, CF12t). Data are means of three MG fruits and each measurement is the mean of three replicates per fruit. Vertical bars represent 95 % confidence intervals. + and * indicate significant differences (P < 0·05) between, respectively, the two tomato lines for a given fruit position and the two fruit positions for a given tomato line.

An official website of the United States government
Here's how you know
Official websites use .gov
A
.gov website belongs to an official
government organization in the United States.
Secure .gov websites use HTTPS
A lock (
) or https:// means you've safely
connected to the .gov website. Share sensitive
information only on official, secure websites.
