
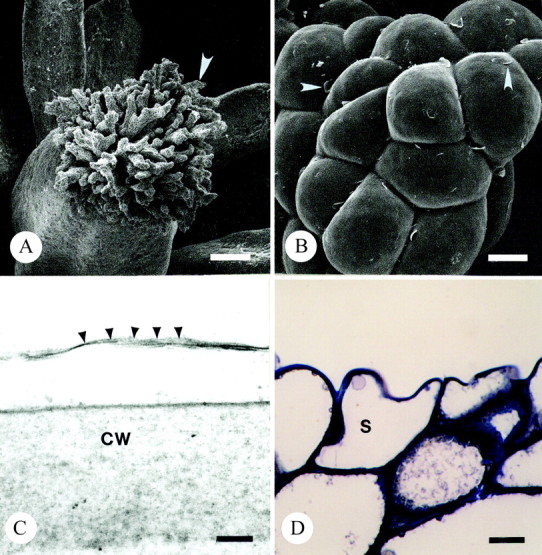
Fig. 3. Light and scanning and transmission electron micrographs illustrating the dry stigma of T. moorei during the ‘female’ phase of floral ontogeny. A, Arrow marks one branch of stigma. Bar = 84 µm. B, Arrowheads denote uplifted cuticle on stigma. Bar = 10 µm. C, Arrowheads illustrate cuticular boundary of stigma. Bar =100 nm. D, Thin section of resin embedded stigma stained with toluidine blue. Note tightly packed vacuolate cells comprising terminal regions of stigma. Bar = 10 µm. CW, cell wall; S, stigmatic epidermal cell.