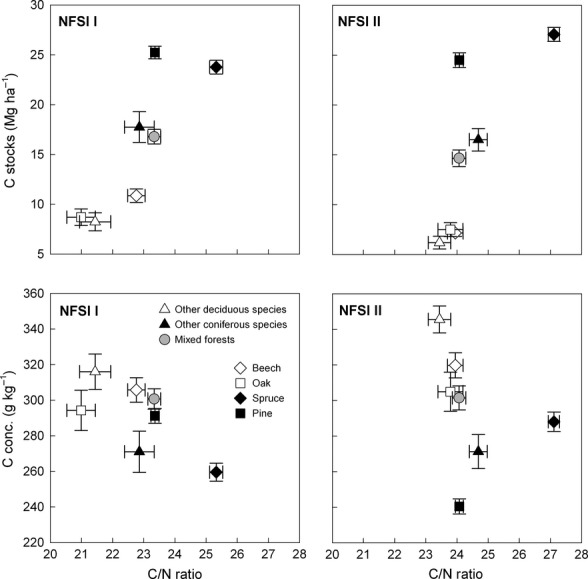
Fig 3.

Soil organic C stocks, C concentrations, and C/N ratios of the organic layer under differing tree species of the first/second (I/II) National Forest Soil Inventory (NFSI). Circles and error bars represent means and standard errors, respectively. The number of observations is ranging from 55 (C/N ratio under oak of NFSI I) to 529 (C stocks under pine of NFSI I).
