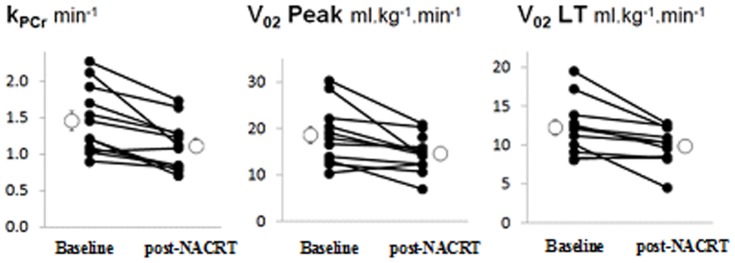
Figure 2.
31P MRS (kPCr) and CPET ( o2 at
o2 at  L and
L and  o2 at Peak) data at Baseline (before NACRT)) and at 48±5 hours post-NACRT: lines link data-points (closed circles) for individual patients, and open circles show overall mean±SEM. Mean changes (SEM) between baseline and post-NACRT are for kPCr −0.4(0.1) min−1, p = 0.001; for
  o2 at
o2 at  L −2.4(0.7) ml.kg−1.min−1, p = 0.004; and for
  o2 Peak −4.0(1.3) ml.kg−1.min−1, p = 0.011.

