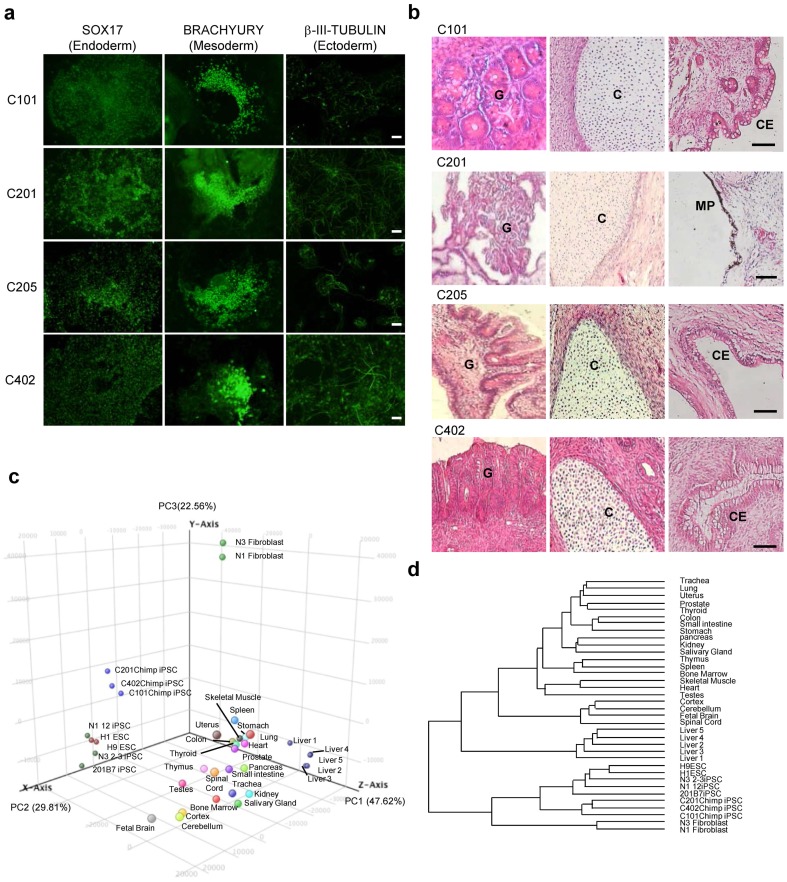
Figure 4. Characterization of chimpanzee iPSCs.
(a) Differentiation into three germ layers in vitro. The chimpanzee iPSC lines can generate SOX17+ (endoderm), BRACHYURY+ (mesoderm), and βIII-tubulin+ (ectoderm) cells. Scale bars, 100 µm. (b) Tissue morphology of a representative teratoma derived from the chimpanzee iPSC lines generated with TS12KOS vector. G, glandular structure (endoderm); C, cartilage (mesoderm); CE, Cuboidal Epithelium structure (ectoderm); MP, melanin pigment (ectoderm). Scale bars, 100 µm. (c) Principal Component Analysis. All data sets were classified into three principal components, PC1 (47.62%), PC2 (29.81%), and PC3 (22.56%), and then simplified into three-dimensional scores. Percentage shows the portion of variance in each component. The position of chimpanzee iPSC lines is closely placed to that of human ESCs and iPSCs. (d) Hierarchical clustering of chimpanzee iPSCs, human iPSCs and ESCs. The data sets of all genes investigated were clustered according to Euclidean distance metrics. The data sets of chimpanzee iPSCs, human ESC and iPSC lines, and various human tissues were classified into separate branches. The datasets of human ESCs and various tissues referred for Gene Expression Omnibus datasets, GSE22167 and GSE33846, respectively.

