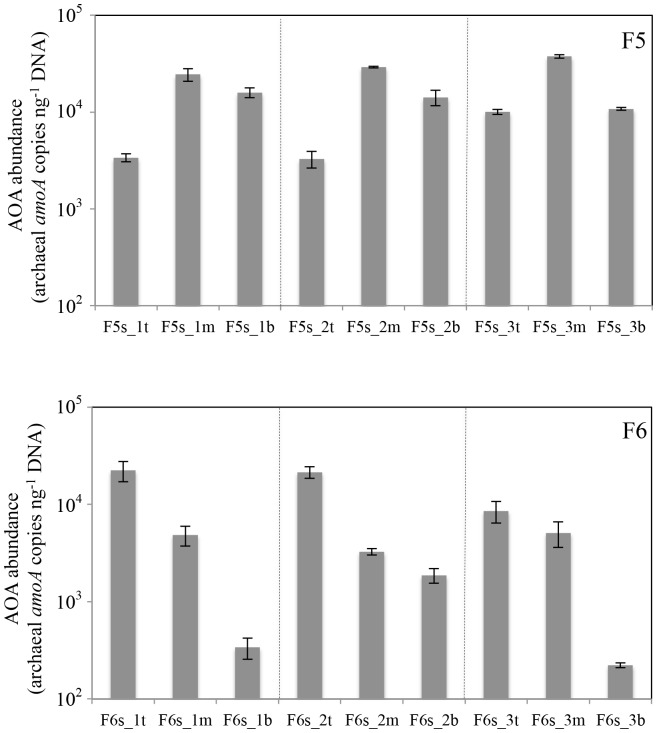
Figure 5. Spatial AOA distribution in multi-media freshwater biofilters F5 (top panel) and F6 (bottom panel).
Error bars correspond to standard deviations based on triplicate qPCR amplifications. Dashed lines separate sampling days. For sample labels, refer to Table 1.

