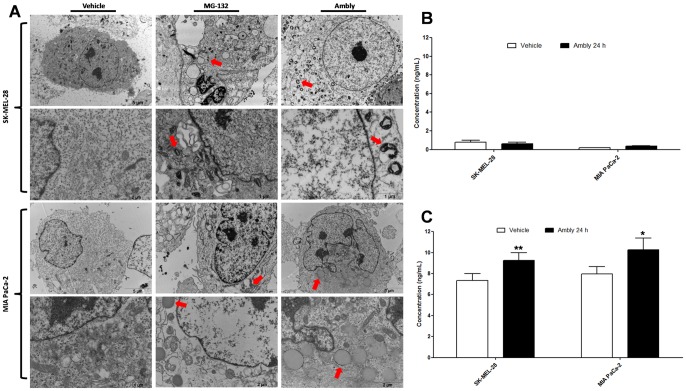
Figure 4. Characterization of aggresomes induced by Amblyomin-X.
(A) Transmission electron microscopy analysis. Cultured cells were treated with vehicle (PBS), 0.5 µM Ambly for 24 h or 5 µM MG-132 for 24 h. Formed aggresomes are indicated by red arrows. Images are representative of five fields from each experiment (n = 3). Quantification of (B) HDAC6 and (C) Bag3 via ELISA. Cultured cells were treated with vehicle (PBS) or 0.5 µM Ambly for 24 h. Results are reported as the means ± standard error of three independent experiments. The criteria and representation of statistical significance were set as *p≤0.05, **p≤0.01, ***p≤0.001 or ns (non-significant).

