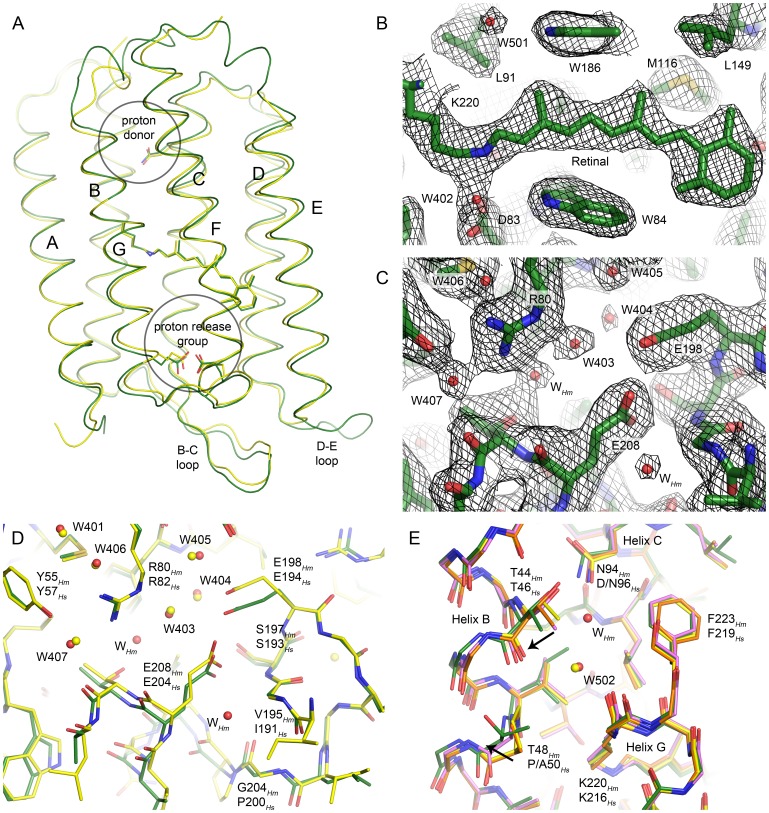
Figure 4. Crystallographic structure of the HmBRI D94N mutant.
(A) Comparison of the HmBRI backbone structure (green) with that of HsBR [23] (yellow). (B) 2Fo-Fc electron density maps in the vicinity of the retinal. The maps are contoured at the level of 1.5 σ. (C) 2Fo-Fc electron density maps in the proton release region. The maps are contoured at the level of 1.2 σ. (D) Comparison of the HmBRI proton release group (green) with that of HsBR [23] (yellow). Overall, the conformations of the side-chains and positions of water molecules are very similar. However, the water accessible space is larger in HmBRI, and additional water molecules are observed (WHm). One of the reasons for this difference might be the substitution of HsBR’ proline 200 with the glycine 204 in HmBRI, that allows unlatching of the extracellular part of the helix G. (E) Comparison of the HmBRI proton donor region with that of wild-type HsBR [23] (green) and its D96N [30] (orange) and P50A [32] (magenta) mutants. It appears that in HmBRI the effects of the D94N mutation and the P50Hs → T48Hm substitution combine and result in a larger displacement of the helix B relative to the helices C and G (black arrows), as similar displacements are present in the P50A and D96N mutants of HsBR, albeit with a smaller amplitude.

