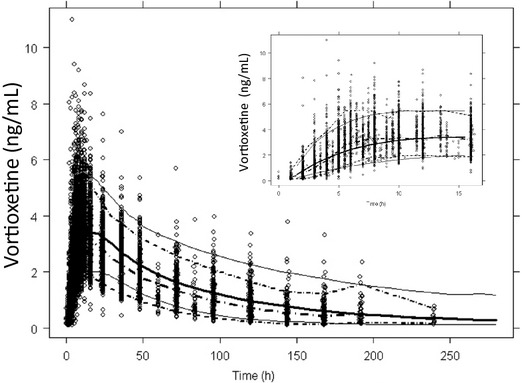
Fig 5.

Visual predictive check (VPC) plot for the final population pharmacokinetic model for vortioxetine in healthy individuals. Dose-normalised observed data (dots) and median, 2.5% and 97.5% percentiles for simulated data (solid lines) and dose-normalised observed data (dotted lines) are shown. The insert shows the first 20 hr after dosing.
