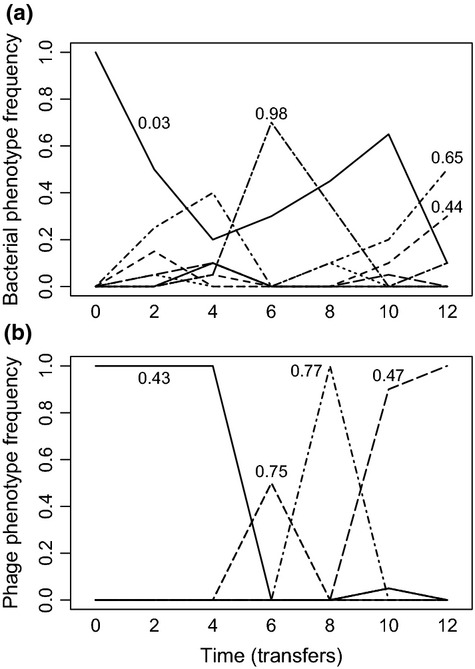
Figure 3.

Temporal dynamics of different bacteria (a) and phage (b) phenotypes (based on cluster analyses with 80% similarity) of a single community evolved under low nutrient conditions. Numbers associated with the dominant phenotypes indicate their resistance/infectivity ranges (i.e. proportion of clonal isolates bacteria could resist/phage could infect).
