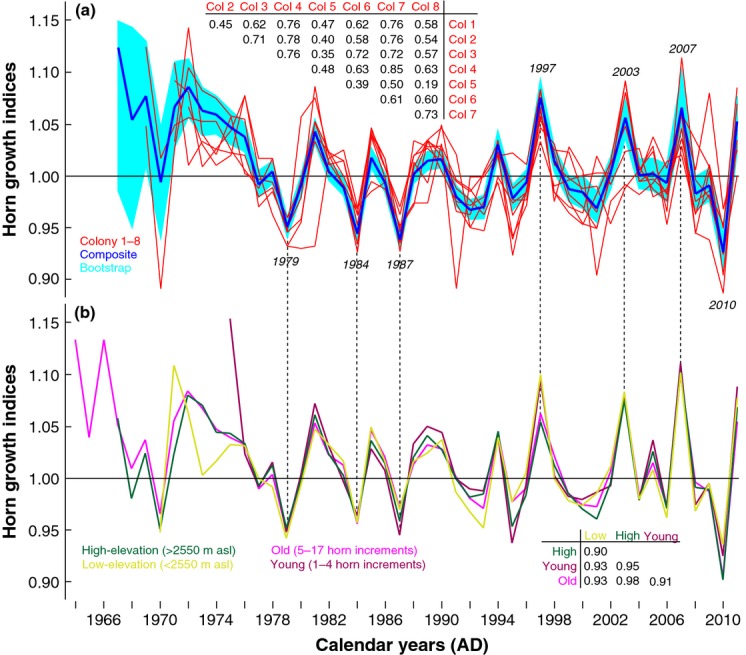
Figure 3.

Horn growth synchrony. (a) Annual horn growth variability of the eight colonies (red) and their composite (blue) and the 95% bootstrap confidence interval (light blue). The RCS detrended chronologies are truncated at a minimum replication of ten horns. Corresponding correlation coefficients between the eight individual horn chronologies were computed over their common period. (b) Comparison between four independent horn growth chronologies using either young (3911 horns) and old (4132 horns) individuals, or low (2530 horns) and high (5513 horns) individuals. Corresponding correlation coefficients between the subset chronologies were computed over the 1982–2011 period.
