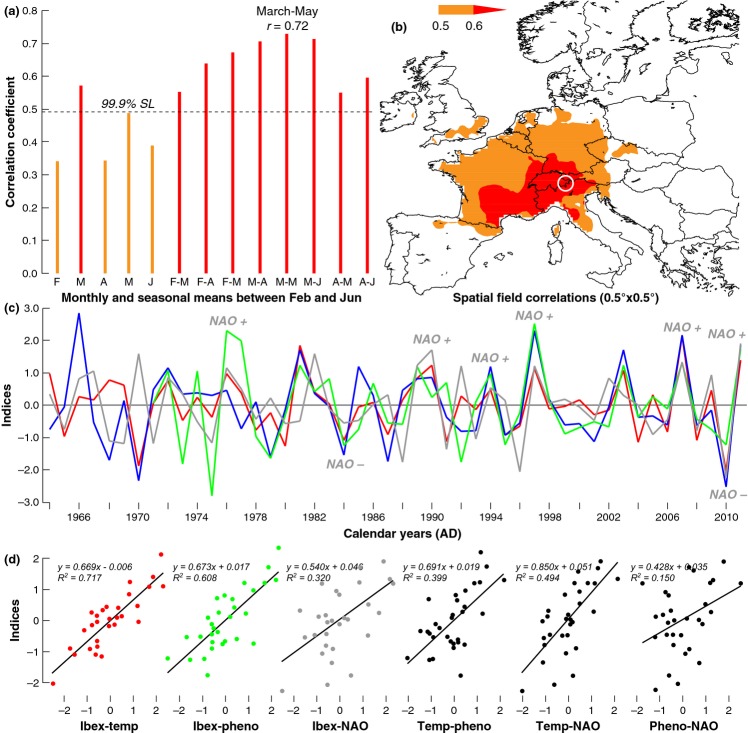
Figure 5.
Relationships between horn growth and temperature. (a) Correlation coefficients between the composite residual RCS horn chronology and monthly and seasonal maximum Alpine temperature means (1982–2011). (b) European-wide spatial correlation field between the composite residual RCS horn chronology and March–May maximum temperatures. (c) Comparison between the composite residual RCS horn chronology (blue), March–May maximum Alpine temperatures (red), inverse springtime phenology of Alpine coltsfoot (green), and February–May NAO indices (grey). All time-series were first scaled to the corresponding March–May (MAM) maximum temperature values (anomalies in °C) back to 1982 and then 10-year high-pass filtered, with (d) showing the corresponding linear regression models of all pairings calculated over the 1982–2011 period.

