
Figure 2. Topographies of microstate A, B, C, and D extracted from various clustering methods and electrode arrays.
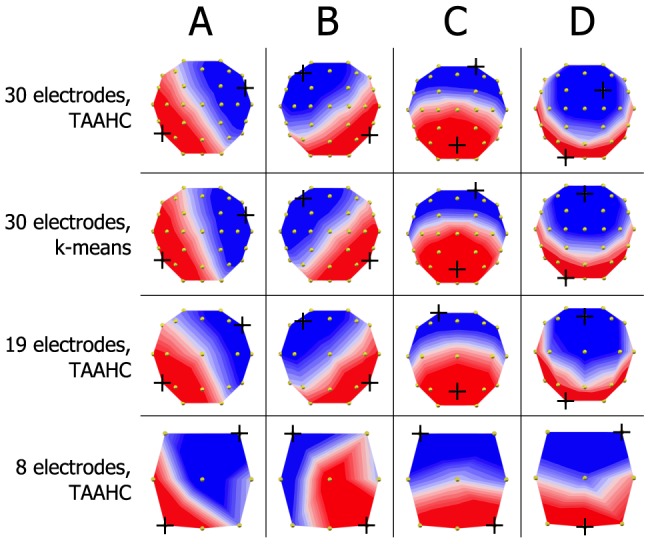
Crosshairs indicate points of maximum or minimum recorded electric potential. The four microstate classes A, B, C, and D have been reported in a number of prior studies. TAAHC and k-means clustering give almost identical microstate maps (first two rows). Because microstates are defined by the topography of electric potentials over the entire scalp, it is possible to identify microstates fewer electrodes. The microstate classes A, B, C, and D are identifiable in 19 and 8 electrode data. These lower-resolution electrode arrays give highly reliable results.