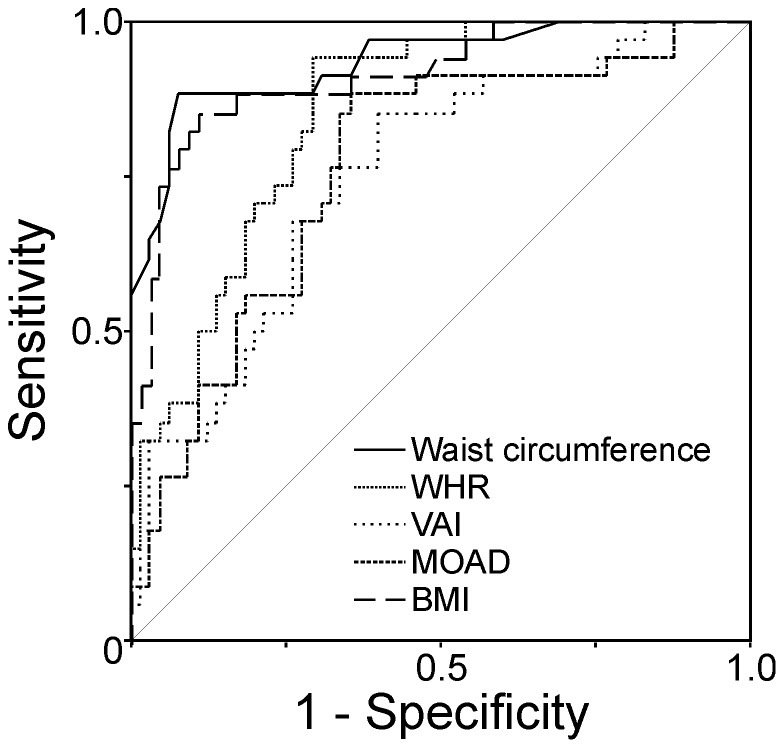
Figure 3. Receiver operating characteristic (ROC) curve analysis of the diagnostic performance of surrogate indexes of visceral adiposity and BMI for the presence or absence of hepatic steatosis.
All ROC curves were statistically significant with P<0.001. The best area under de ROC curve was that of waist circumference (0.935±SE 0.027) which was better than those of WHR (difference 0.08, 95% confidence interval 0.01–0.16), VAI (difference 0.18, 95% confidence interval 0.10–0.26 and MOAD (difference 0.17, 95% confidence interval 0.08–0.26), but was not different than that of BMI (difference 0.02, 95% confidence interval −0.01 – to 0.05, P = 0.155). Similarly, the area under the ROC curve of BMI was better compared with those of VAI (difference 0.16, 95% confidence interval 0.08–0.24, P<0.001) and MOAD (difference 0.15, 95% confidence interval 0.04–0.26, P = 0.007) but was not different than that of WHR (difference 0.06, 95% confidence interval 0.03 – to 0.15, P = 0.176).

