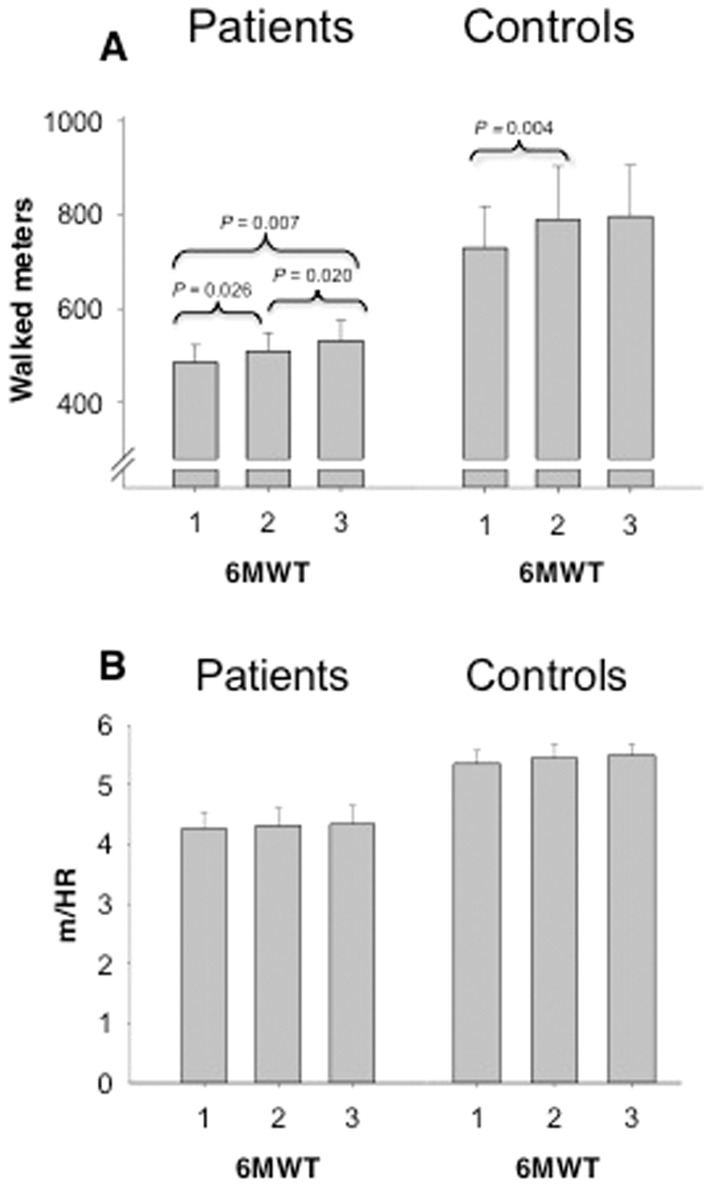
Figure 1. Distance walked with, and without heart rate correction.
A. Mean distance walked in all 6-minute walk tests, for both patients and controls. The graph shows the significant increases, marked by the p-value, in mean walked distance among tests. B. Heart rate corrected 6-minute walk distance in all 6-minute walk tests, for both patients and controls. No significant difference between walked distances was observed.

