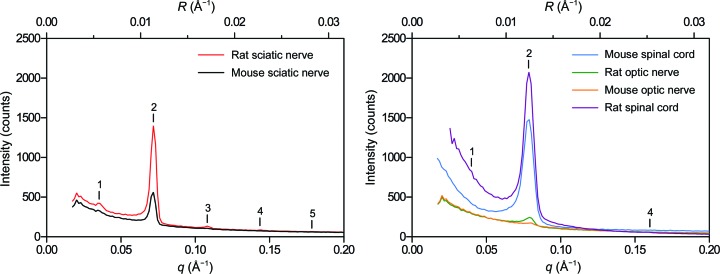
Figure 3.
Comparison of neutron diffraction from rat and mouse (left) peripheral and (right) central nervous system tissue. Neutron diffraction patterns have only been corrected for detector efficiency, solid angle and exposure time to demonstrate the relative intensities of the second-order Bragg reflection from the respective samples. Scattering intensity is plotted against both the scattering vector q (Å−1) and the reciprocal coordinate R (Å−1). Bragg orders are indicated with numerals above the reflections.

