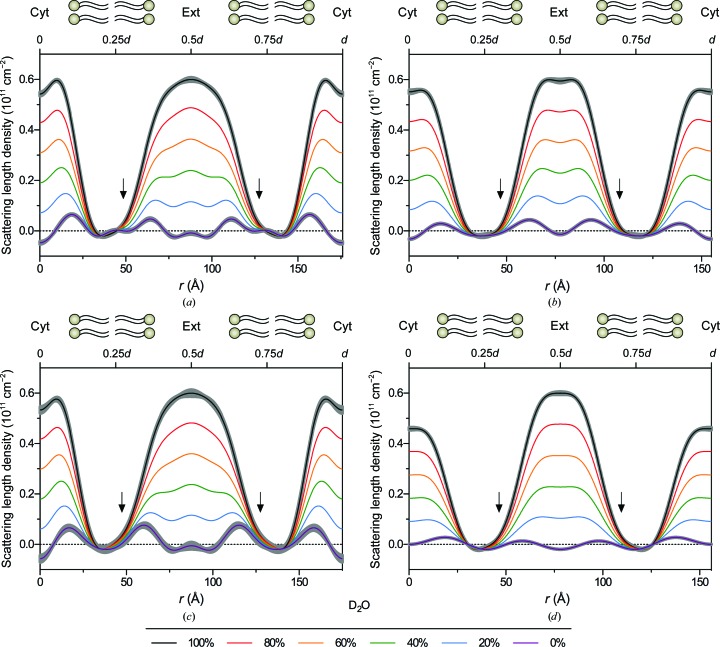
Figure 5.
Neutron scattering length density profiles from (a) rat sciatic nerves, (b) rat optic nerves, (c) mouse sciatic nerves and (d) mouse spinal cords in 0–100% D2O-saline. Scattering length density is plotted against radial distance r, with the centre of the cytoplasmic apposition at r = 0. For clarity in the bilayer regions, uncertainty (grey borders) was included only for the profiles calculated for myelin in 0 and 100% D2O-saline. The arrow indicates the higher level of neutron scattering density in the extracellular half of the bilayer, which is proposed to relate to an asymmetric distribution of cholesterol. For each panel, the upper x axis indicates the positions of 0.25d, 0.5d, 0.75d and d.

