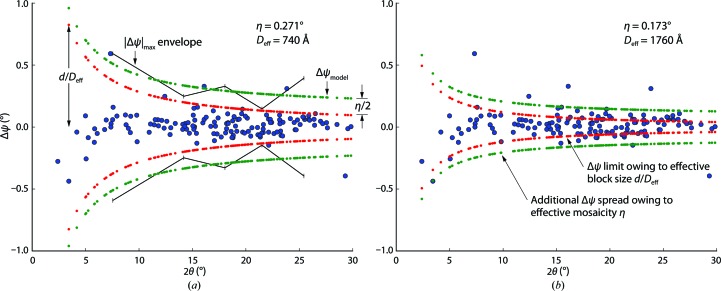
Figure 7.
Two methods for fitting the mosaicity and mosaic block size. Δψ values for bright spots from a single thermolysin still image (blue circles) are plotted as a function of the diffraction angle 2θ, which is inversely related to the resolution d by Bragg’s law. A wider spread of Δψ values is observed at low 2θ. The best integrated intensities are obtained by finding the function Δψmodel (green curve) that minimally envelopes the spots. (16) breaks Δψmodel into a resolution-dependent term containing the effective mosaic block size D eff (inner red curve) and a peripheral zone of constant width determined by the effective mosaic spread η. Alternate algorithms determine these parameters either by (a) least-squares fit of the |Δψ|max values determined for resolution bins or (b) maximum-likelihood treatment of all of the data. Approach (b) consistently gives more realistic fits with smaller η and larger D eff values. Plots reflect refinement results from protocol 6 (Table 2 ▶).

