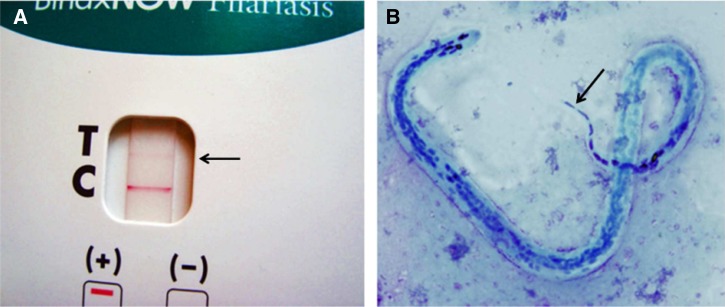
Figure 2.
A shows a weakly positive ICT card test from a subject from the Ituri region with L. loa Mf. Note that the test line (T; marked with an arrow) is the same color as the control (C) line. B shows a Giemsa-stained L. loa Mf in a night blood smear from the same subject. Note the characteristic elongated nuclei in the tip of the tail (arrow).

