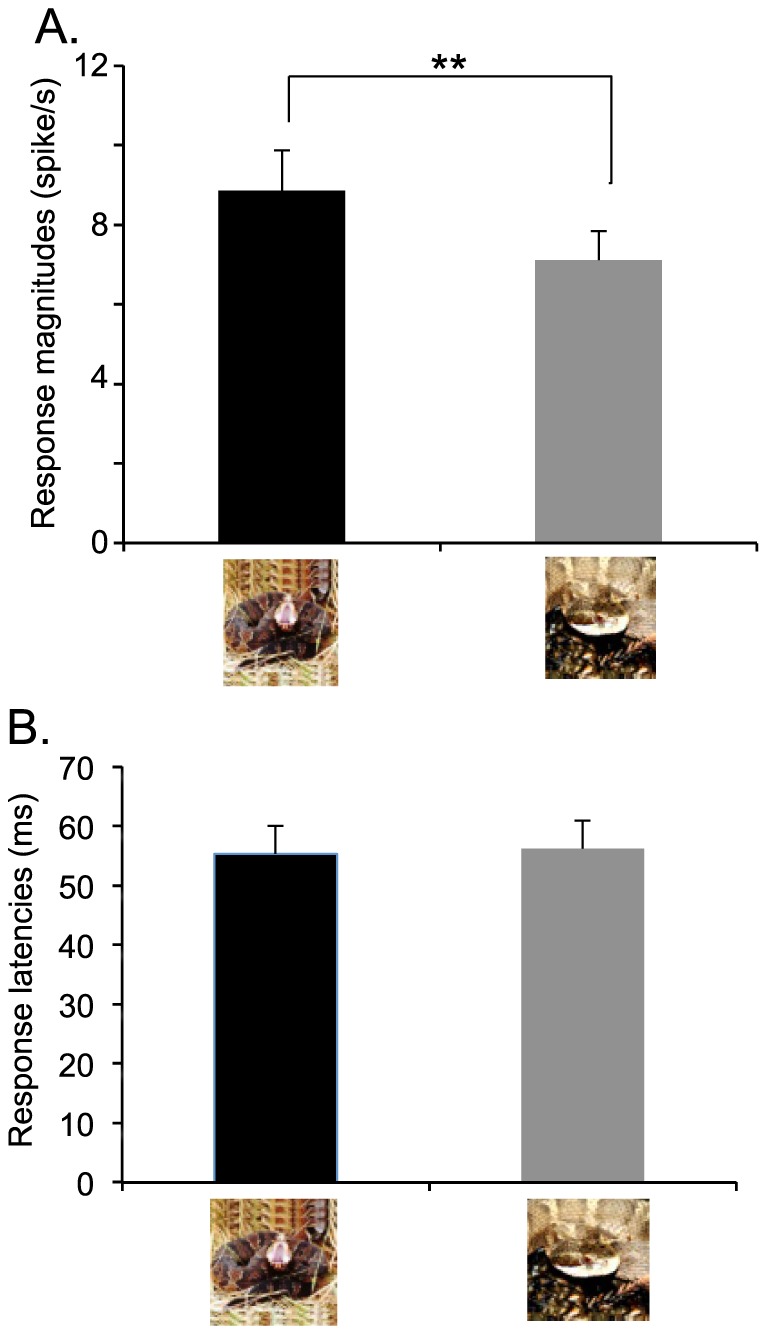
Figure 2. Comparison of mean response magnitudes (n = 78) (A) and latencies (n = 52) (B) to the snakes in threat display vs. non-threat-displaying postures.

There was no significant difference between response latency to threatening snakes and snakes in non-threat-displaying postures (paired t-test, t(51) = 0.424, P = 0.673). In contrast, mean response magnitudes to snakes in threat display were significantly larger than to non-threat-displaying snakes. ** significant difference (paired t-test, t(77) = 3.056, P = 0.003). Columns and error bars indicate means with SEM.
