
Figure 3. Distributions of the 6 visual stimuli in a two-dimensional space resulting from multidimensional scaling using responses of the 78 neurons to these stimuli in epoch 1 (A), epoch 2 (B).
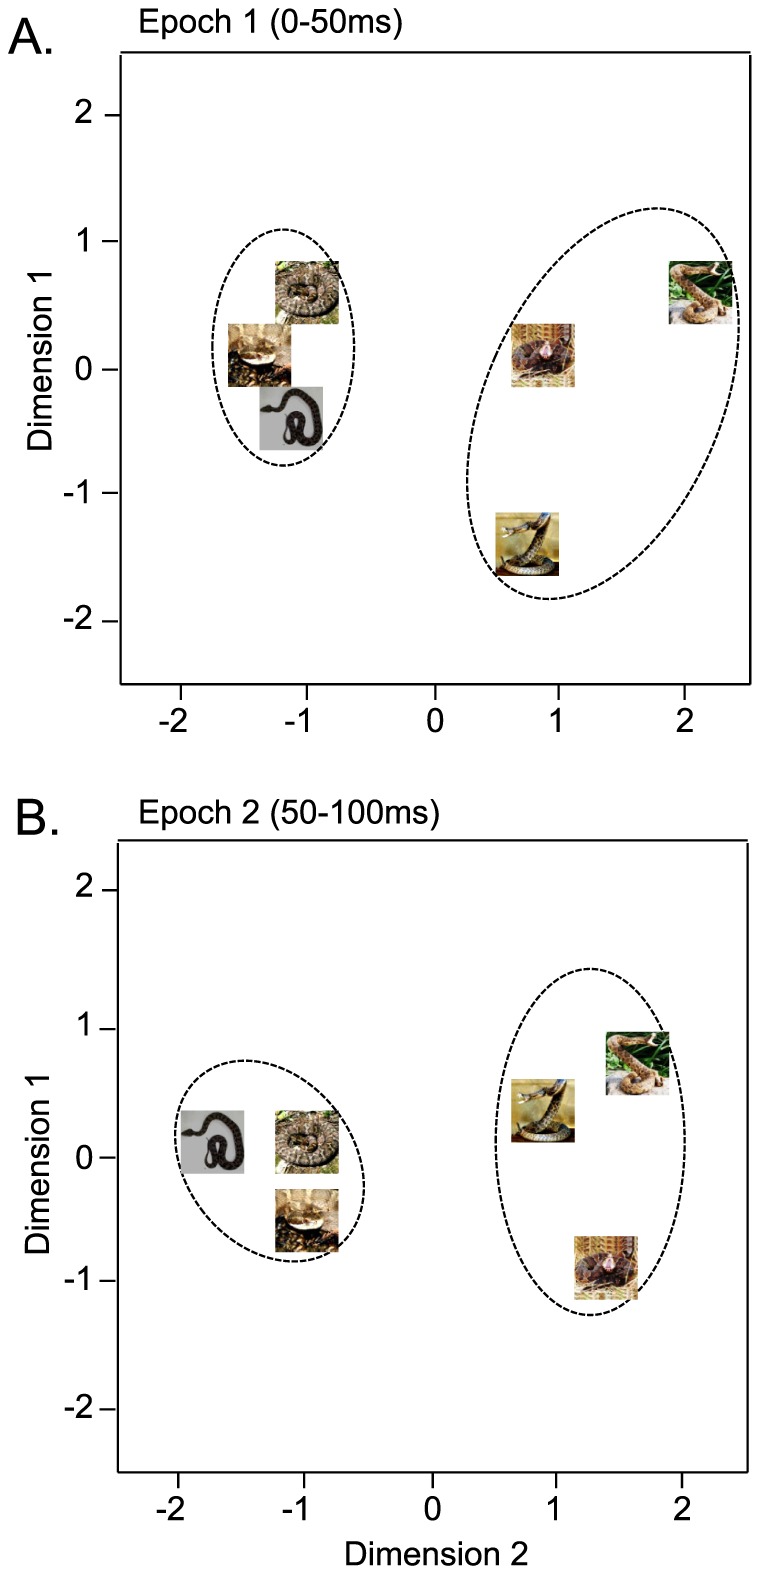
In epochs 1 and 2 (A, B), the snakes in threat display were separated from the non-threat-displaying snakes.