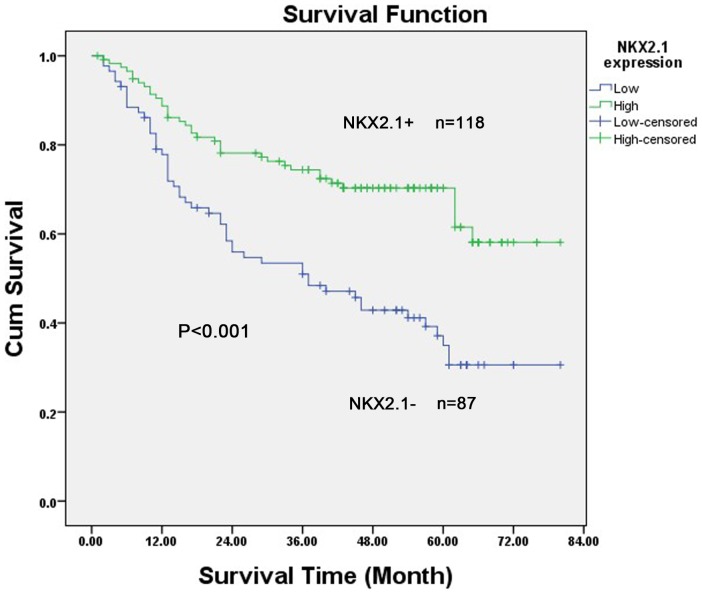
Figure 4. Kaplan–Meier survival curves for subjects with gastric carcinoma (n = 205) patients with high NKX2.1 expression (n = 118) and low NKX2.1 expression (n = 87) after resection.
Patients in the high-expression group exhibited significantly better survival than those in the low-expression group (log-rank test: P<0.001).

