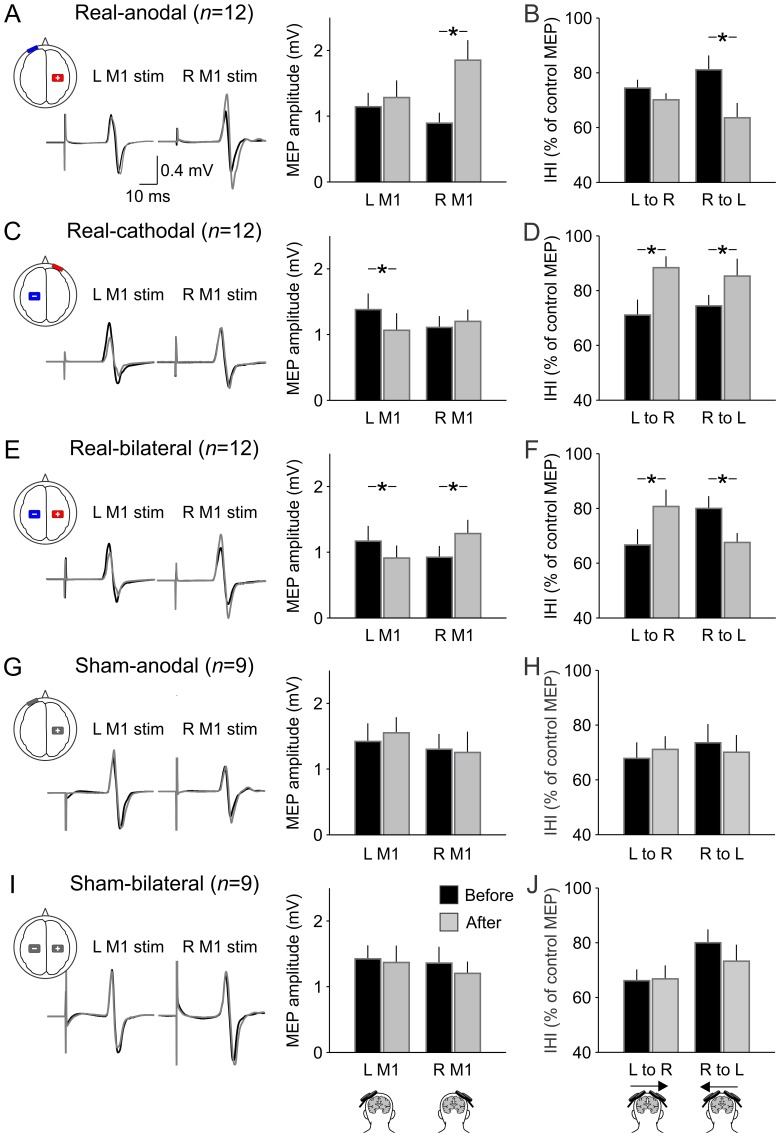
Figure 1. tDCS after-effects on MEPs and IHI.
From top to bottom, real-anodal tDCS (A, B), real-cathodal tDCS (C, D), real-bilateral tDCS (E, F), sham-anodal tDCS (G, H), and sham-bilateral tDCS (I, J). The left and right sides of the traces are MEPs that are elicited by single-pulse TMS over the left M1 and right M1, respectively. The black and gray lines indicate MEPs that were elicited before and after DCS, respectively. The left bar graphs (A, C, E, G, J) show the average data of MEP of all participants. The sets of the left- and the right-sided columns represent MEP amplitude elicited by left (L) M1 stimulation and right (R) M1 stimulation, respectively. The rights bar graphs (B, D, F, H, J) show the average data of IHI of all participants. IHI was expressed as the ratio of the conditioned MEP amplitude normalized by the control MEP amplitude (i.e., larger value indicates less IHI). The sets of the left- and right-sided columns represent IHI from the left M1 to the right one (L to R) and that from the right M1 to the left one (R to L), respectively. The black and gray columns represent before and after tDCS, respectively. Error bas show standard error of means. The asterisks indicate a significant difference; * p<0.05.

