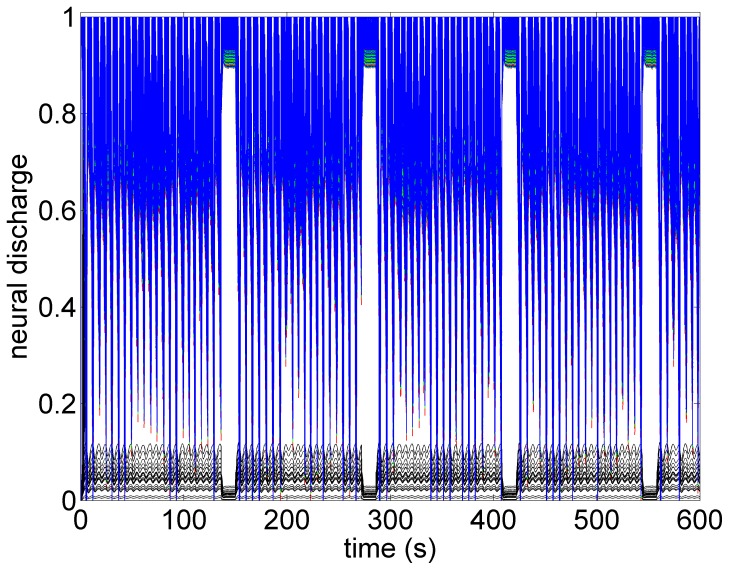
Figure 13. A map of neural activity (discharge) at the three levels of the neural network under the model parasympathetic threshold conditions and corresponding to the pattern of heart rate observed in Figure 9.
Here the direct component of the VSC is stimulated, with the level of stimulation of the indirect component being maintained the same as under the sympathetic threshold conditions. The direct component of the VSC dominates, leading to the bradycardia observed in Figure 9. Legend as in the caption of Figure 10.

