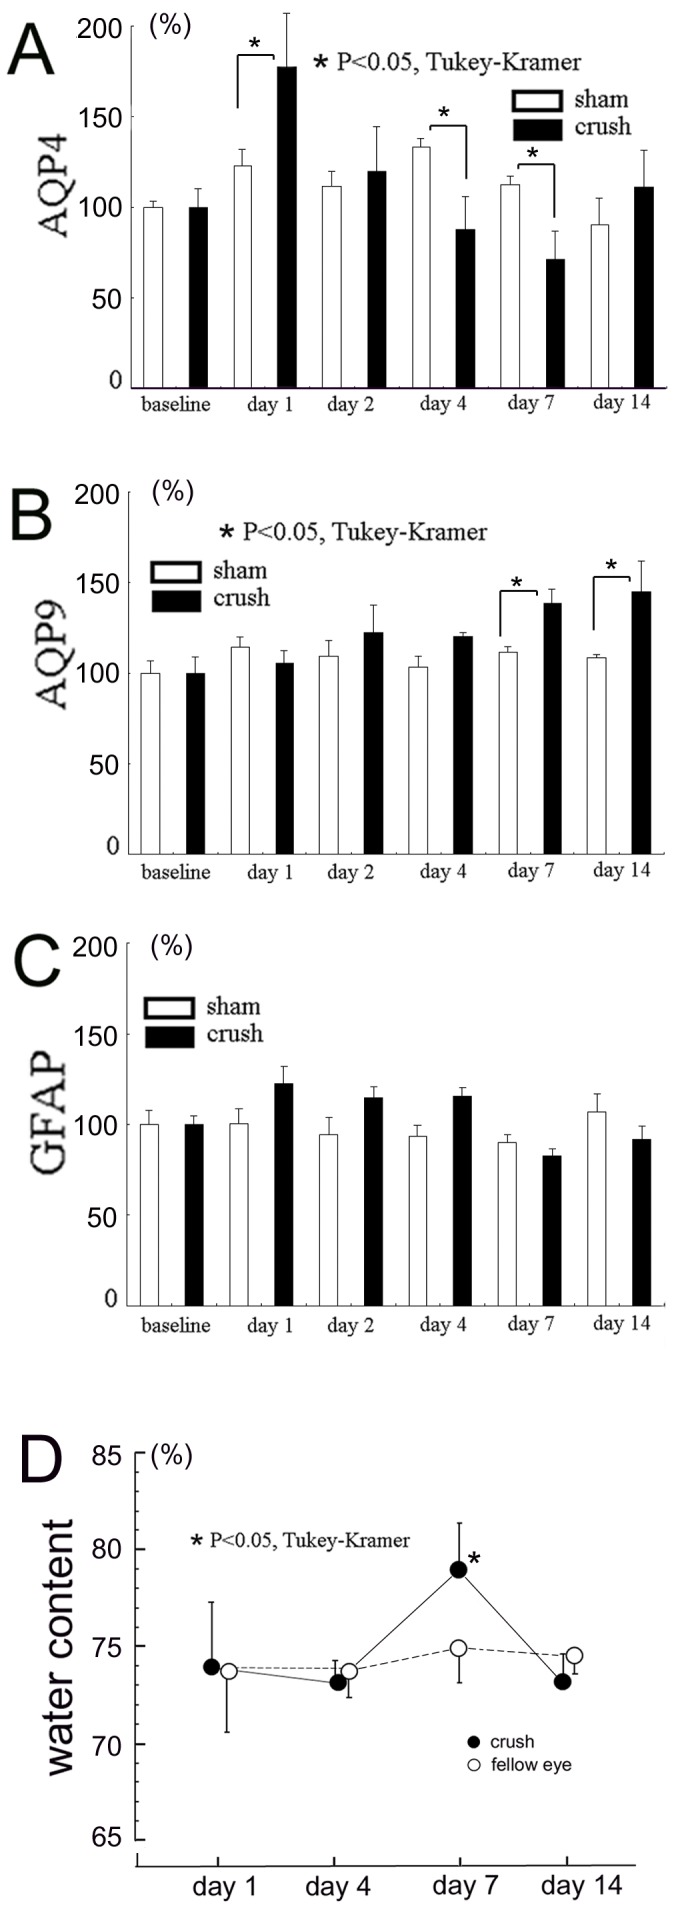
Figure 2. Western blot analyses for AQP4 (A), AQP9 (B), and GFAP (C).

A.-C. Changes in the protein levels of AQP4 (A), AQP9 (B), and GFAP (C). Four optic nerves (4 mm in length) centered on the crush sites were serially excised and pooled as one sample at each time point. Proteins were extracted from the pooled samples and assays were run in triplicate at each time point using the pooled samples. D. Changes of water content in the optic nerve. Water content is expressed as percentages to the wet weight (n = 4 at each time point). Data are the means ± standard deviations (SDs). Asterisks indicate significant differences between the crushed optic nerve and the untouched fellow nerve at each time point (P<0.05, ANOVA followed by Tukey-Kramer).
