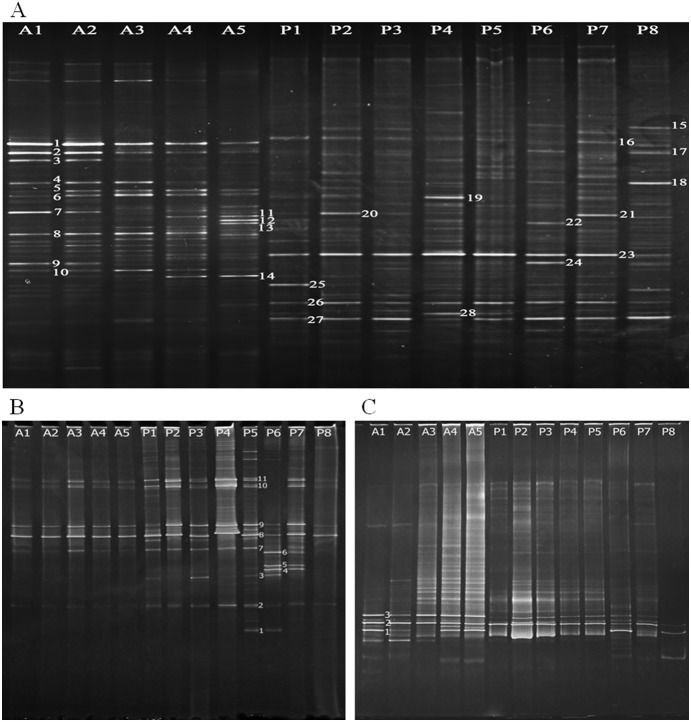
Figure 3. DGGE profiles of 16S rRNA and amoA genes.
16S rRNA genes (A), AOB amoA genes (B), and AOA amoA genes (C) were amplified from the flowing (A1–5) and the stationary phase (packing material) (P1–8), respectively. Electrophoresis was carried out at a constant voltage of 80 V at 60°C for 12 h. Gels were stained with GoldViewer dye. A1–5: the Inlet, Sampling port 1–3, and the Outlet, correspondingly; P1–8: Packing 1–8, correspondingly.

