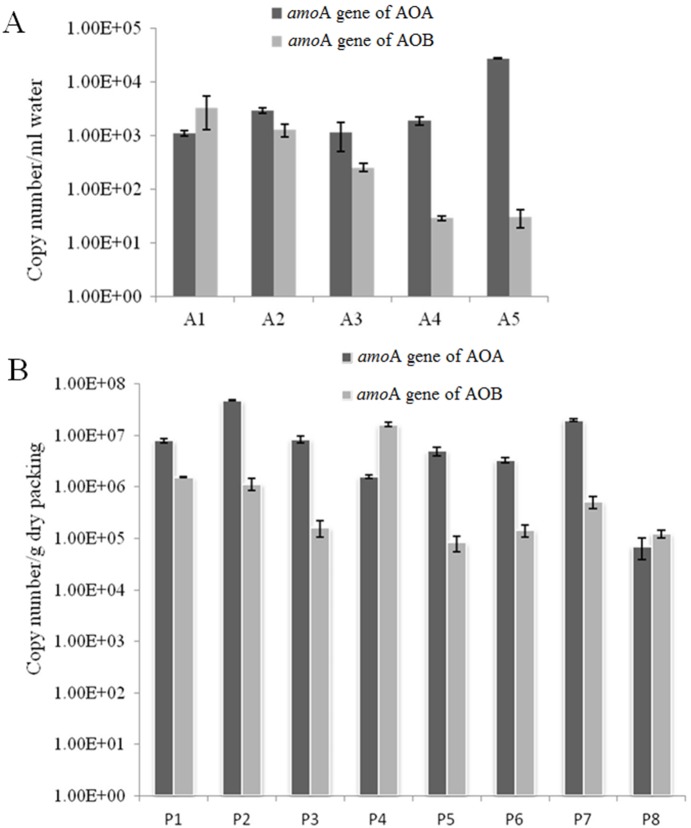
Figure 5. The copy numbers of AOB and AOA amoA genes from the flowing (A) and the stationary phase (B).
All data are the means of values obtained from three parallel experiments ± SD (t-test, p<0.01) using the ΔΔCT method. A1–5: the Inlet, Sampling port 1–3, and the Outlet, correspondingly; P1–8: Packing 1–8, correspondingly.

