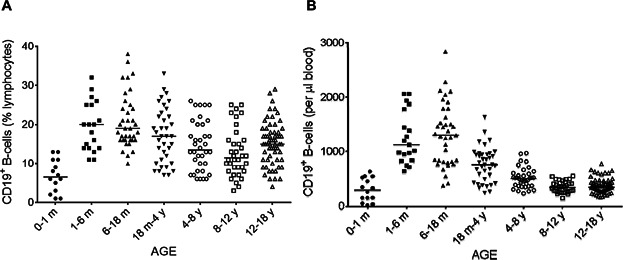
Figure 2.

Changes in the percentage (A) and absolute number (B) of total B-cells with age. The proportions of lymphocytes accounted for by total B-cells (CD19+) (A) were analyzed by flow cytometry on whole-blood samples. The corresponding absolute numbers (B) were calculated from the absolute numbers of lymphocytes. Solid horizontal lines indicate the median values for each age group. m = month; y = year.
