Figure 2.

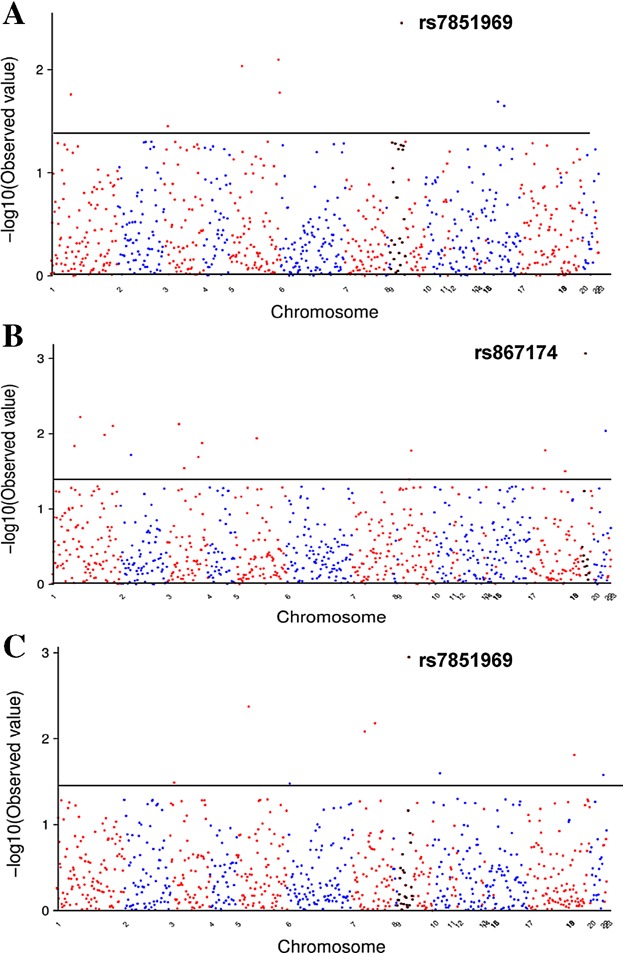
The −log10 (P value) for associations of genotyped SNPs with (A) allergic sensitization, (B) cockroach allergen, and (C) house dust mite. The x-axis represents individual SNP. The gray line represents P = 0.05.

The −log10 (P value) for associations of genotyped SNPs with (A) allergic sensitization, (B) cockroach allergen, and (C) house dust mite. The x-axis represents individual SNP. The gray line represents P = 0.05.