
Figure 1.
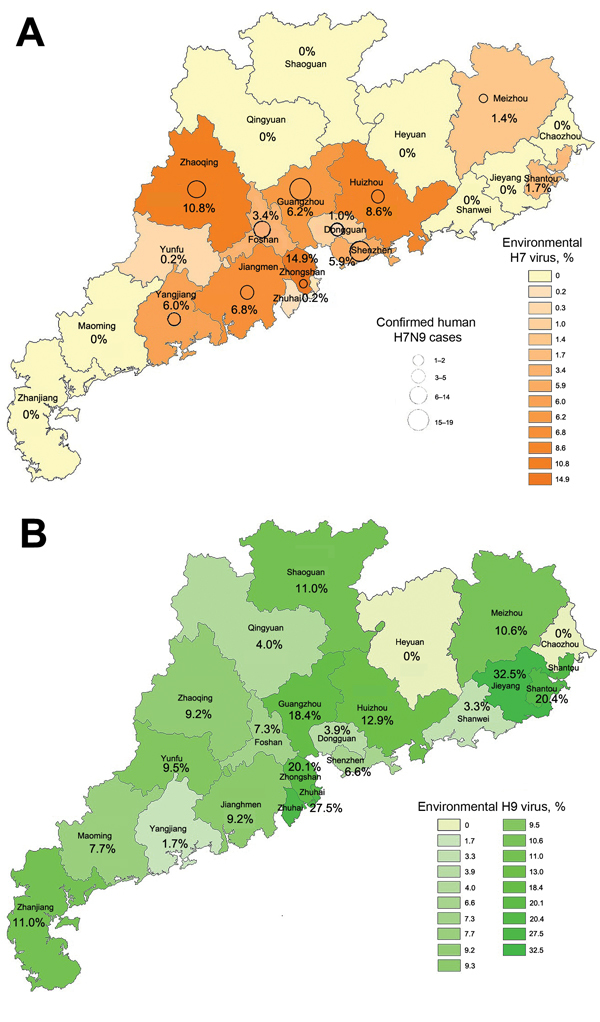
Distribution of influenza A H9 (A) and H7 (B) viruses, Guandong Province, China, 2013–2014. Shading indicates percentage of environmental swab specimens from live poultry markets in each region that were positive for each influenza subtype by reverse transcription PCR. Circles indicate locations of human cases; larger circles indicate higher numbers of cases.