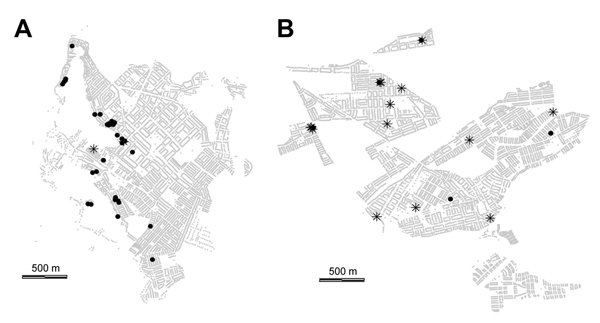
Figure 2.

Infestation during the surveillance phase of a Chagas disease vector control program shown by history of treatment during the treatment phase for A) Jacobo Hunter District (treatment phase during 2003–2005) and B) Paucarpata District (treatment phase during 2006–2009, Arequipa, Peru. Stars indicate households infested during surveillance phase and not treated during treatment phase; black circles indicate households infested during surveillance phase but treated during the treatment phase; and light gray dots indicate other households (their alignment produces what appears as the background pattern of streets).
