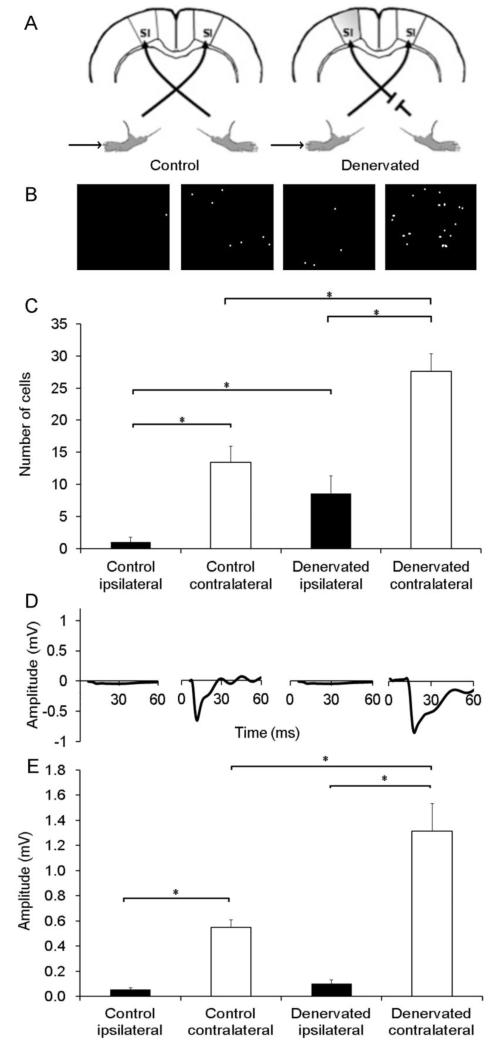
Figure 3. Real-time increases in c-fos expression associated with post-injury plasticity in layer V of S1.
A. Schematic experimental paradigm describes the experimental conditions. B. Representative optical images of cells, and (C) quantification of the number of cells shows increases in fluorescence in S1, both contralateral (white bars) and ipsilateral (black bars) to intact forepaw stimulation in denervated rats compared to controls. Representative evoked LFP (D) and quantification of the evoked LFP negative deflection (E) demonstrate that forepaw stimulation induced evoked LFP responses in S1 contralateral to stimulation. * represent a p-value<0.05.

