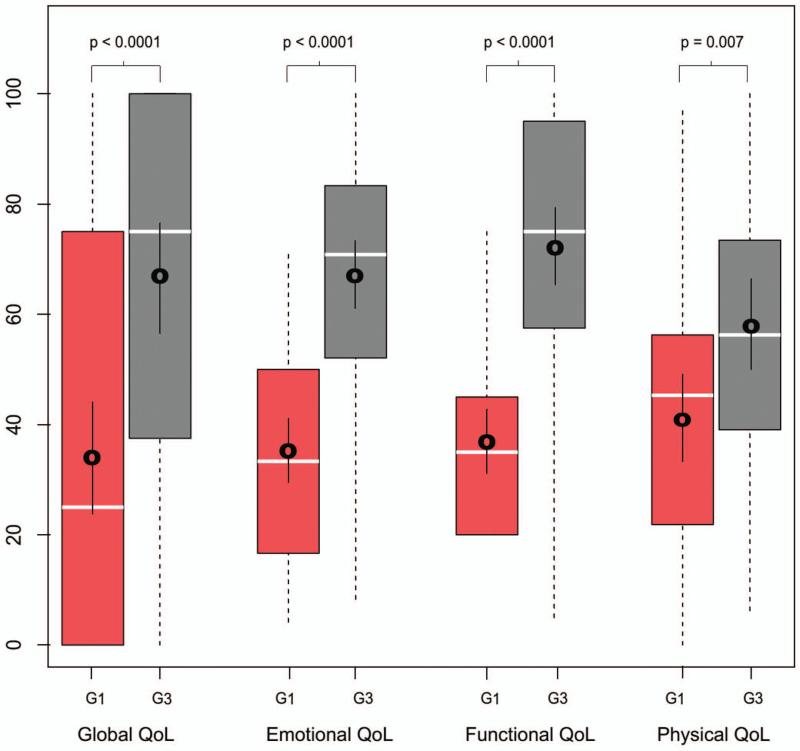
Figure 4.
Box plot demonstrating patient reported quality of life broken into the 4 domains; global, emotional, functional and physical. Generation 1 is in red and generation 3 in grey. Boxes indicate the 25-75 quartiles with dashed lines to the minimum and maximum; median is represented by white bar; mean with 95% CI bars is represented by black mark with bars surrounding. All p values were significant by Wilcoxon Rank Sum test.

