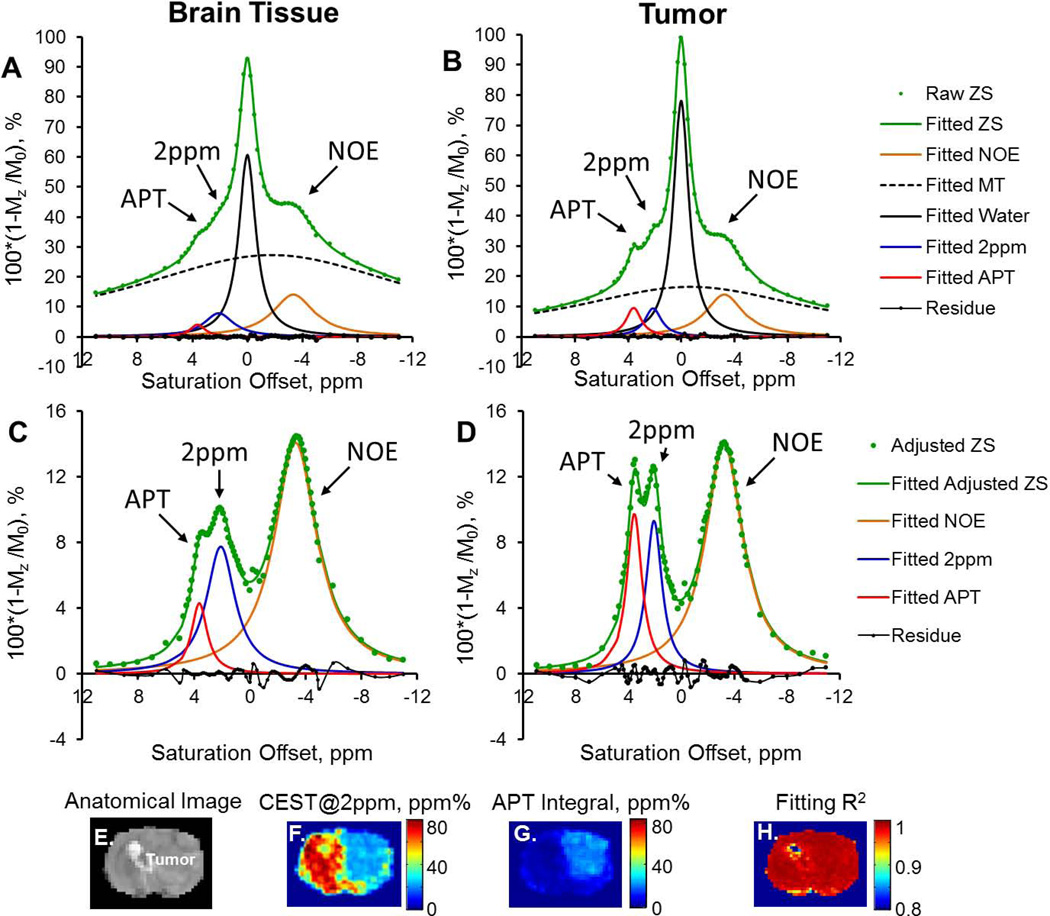
Figure 2.
Z-spectra (ZS), scaled upside down, from normal brain (Left column) and brain tumor (Right column) were fitted with a sum of five Lorentzian functions (A and B). Water DS and MT were then subtracted from the entire Z-spectra (adjusted ZS) for a secondary fitting of NOE, CEST@2ppm and APT (C and D). The anatomic image (E), pixel-wise fitted CEST@2ppm (F), APT (G) maps, and the corresponding R2 map are shown from E to H.

