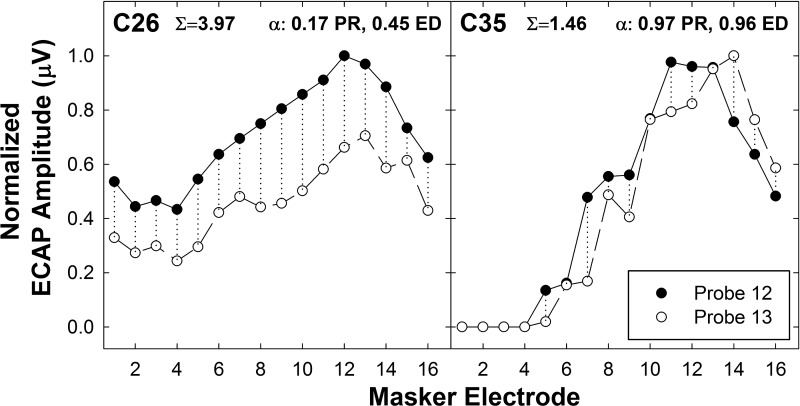
FIG. 1.
Illustration of the hypothesis that greater ECAP SOE separation (Σ) for adjacent probe electrodes is associated with lower (better) α thresholds (left panel, subject C26) and less ECAP SOE separation (Σ) is associated with higher (poorer) α thresholds (right panel, C35). Normalized ECAP SOE functions are plotted for the basal probe set for each subject (probe 12, filled circles; probe 13, unfilled). Dotted vertical lines indicate the spatial separation (Σ) between adjacent SOE functions. ECAP Σ and α thresholds for pitch ranking (PR) and electrode discrimination (ED) are indicated in the top right corner of each panel. As hypothesized, subject C26 had greater ECAP SOE separation (Σ = 3.97), with better α thresholds (α = 0.17 for pitch ranking, α = 0.45 for electrode discrimination). C35 had less ECAP SOE separation (Σ = 1.46), with poorer α thresholds (α = 0.97 for pitch ranking, and α = 0.96 for electrode discrimination).

