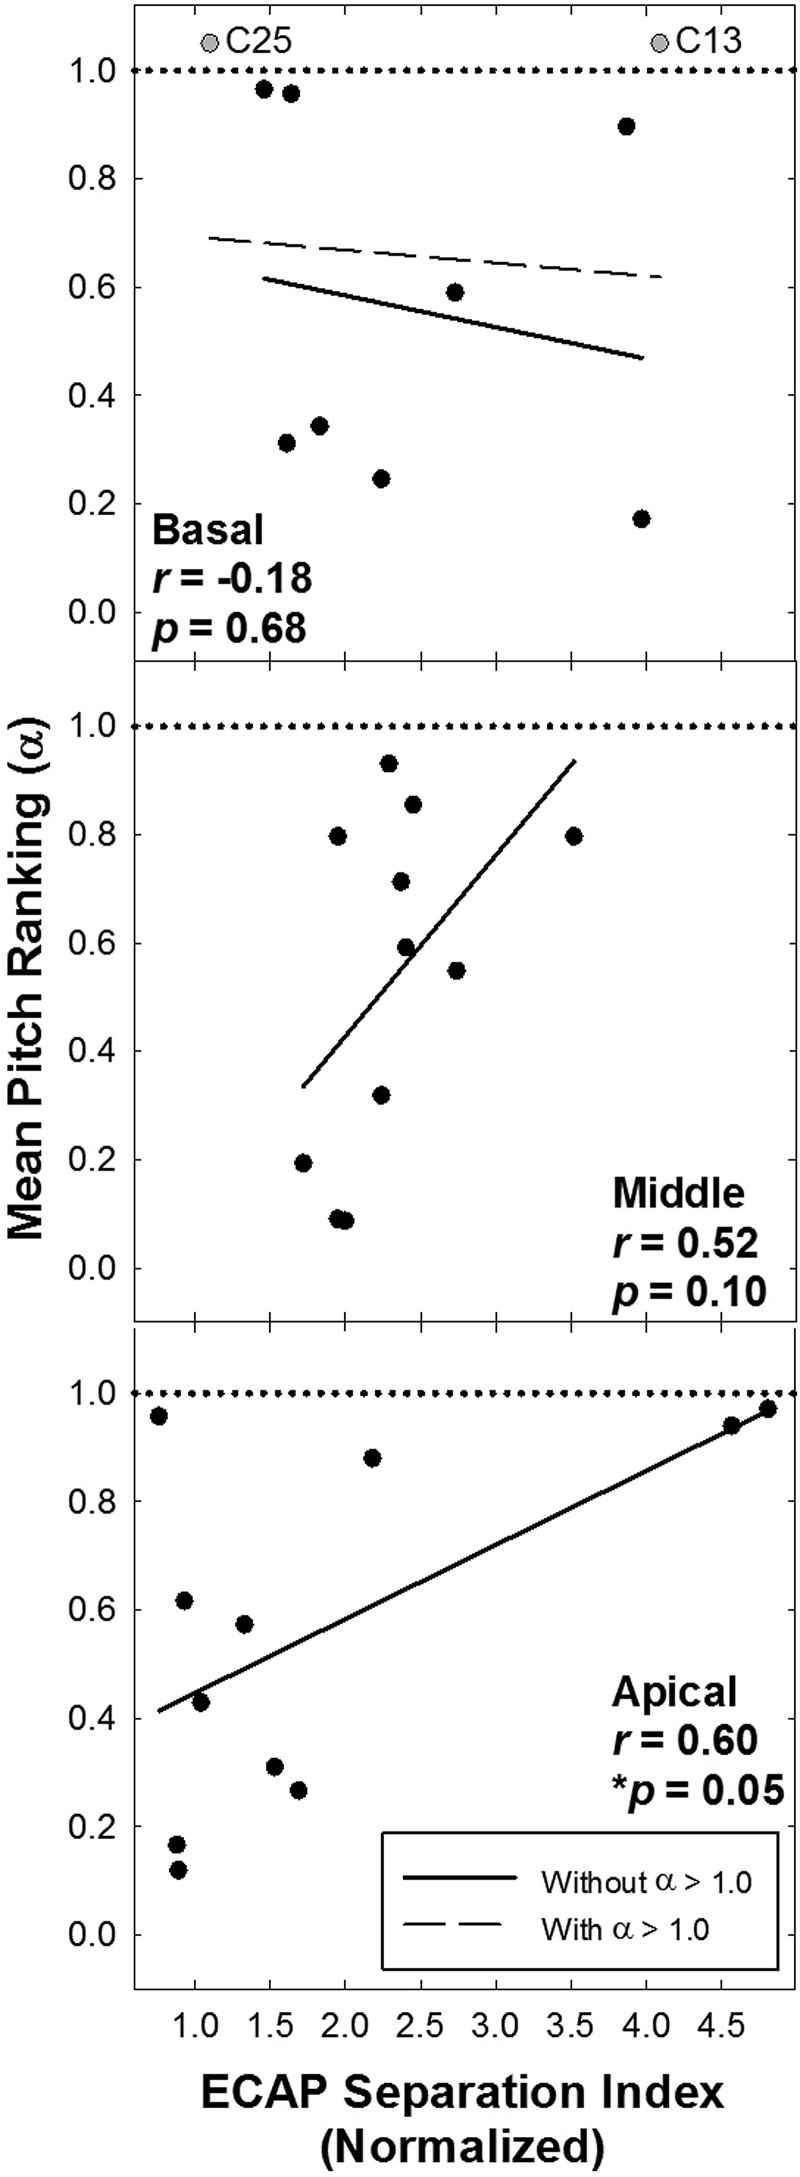
FIG. 3.
Mean pitch ranking thresholds (α) as a function of normalized ECAP separation indices (Σ) for basal, middle, and apical electrode regions (top to bottom, respectively). Subjects who could not pitch rank the adjacent physical electrodes (α > 1.0) are indicated by the circles above the dotted line at α = 1.0, and are labeled with the corresponding subject number. The solid regression line and Pearson correlation values labeled on the graph represent the ECAP versus pitch ranking α comparison without the α > 1.0 subjects. The dashed regression line in the basal panel reflects the subjects in which α > 1.0 were included in the analysis. These corresponding r- and p-values are listed in the text.

