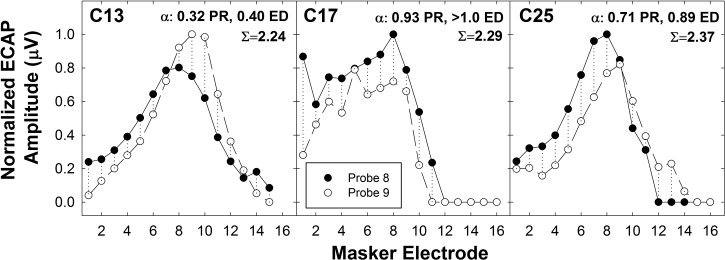
FIG. 5.
Example showing similar ECAP separation indices (Σ) across the middle probe region for three participants (C13, C17, and C25, labeled left to right in the figure), but with various levels of performance on the psychophysical tasks (α values). Separation indices (Σ) and α values are given in the top right corner of each panel for pitch ranking (PR) and electrode discrimination (ED). Probe 8 is the filled circle; probe 9 is unfilled. Dotted vertical lines indicate the amount of spatial separation (Σ) between the two SOE functions.

