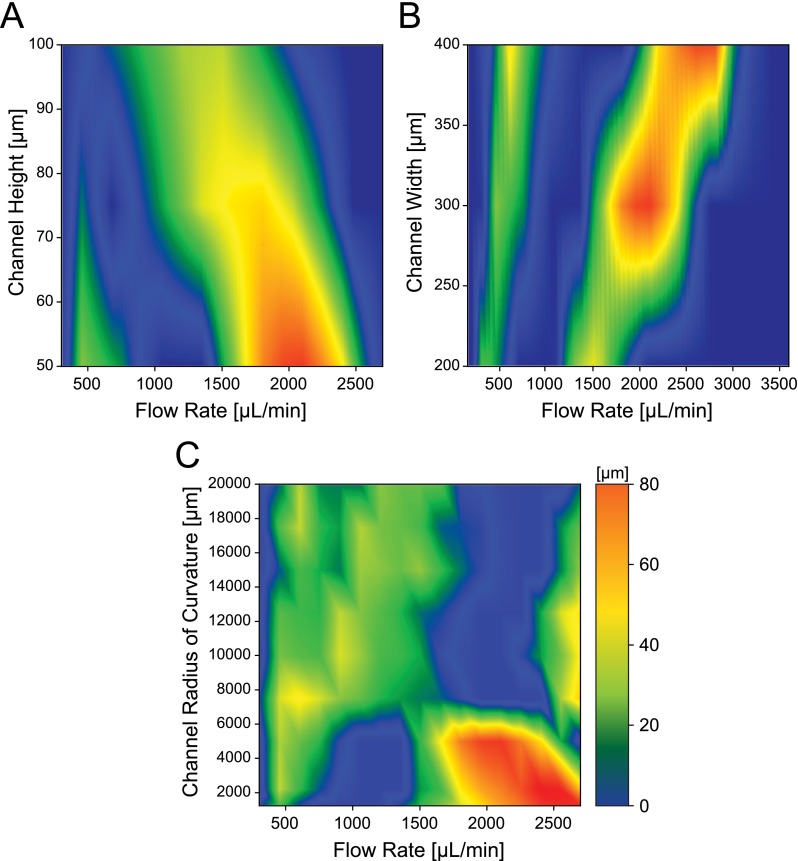
FIG. 3.
State diagrams of separation distances between 10 μm and 20 μm focused particle streaks measured by the half-width-peak intensity as a function of volumetric flow rate in a (a) curved channel with rectangular cross section of 300 μm width and varying height, at a 5000 μm radius of curvature; (b) curved channel with rectangular cross section of 50 μm height and varying width, at 5000 μm radius of curvature; (c) curved channel with rectangular cross section of 50 μm × 300 μm (H W) with varying curvature. State maps are generated using linear interpolation from individual data points obtained experimentally in units of micrometer.

