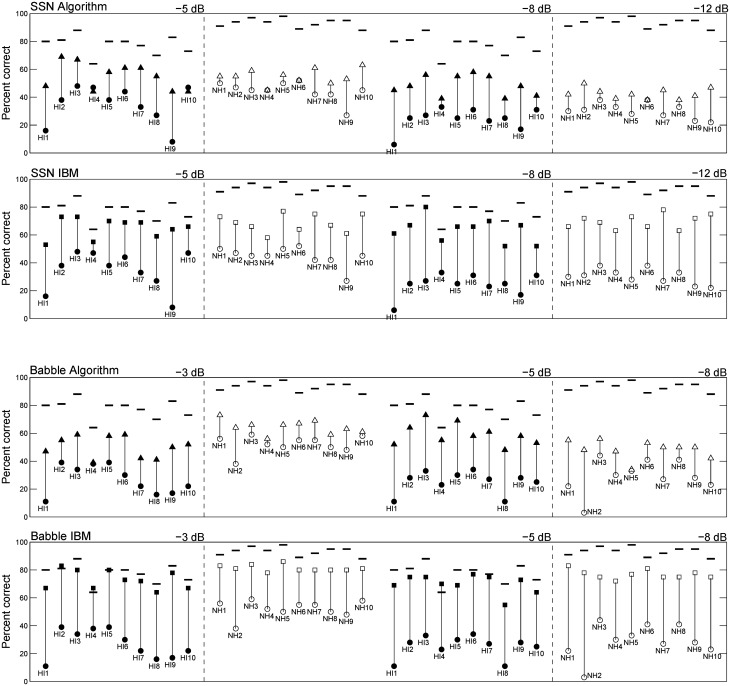
FIG. 2.
Mean VCV phoneme recognition for each listener. Hearing-impaired listeners are represented by filled symbols and NH listeners are represented by open symbols. Unprocessed speech-in-noise conditions are represented by circles, algorithm-processed conditions are represented by triangles, IBM-processed conditions are represented by squares, and speech-in-quiet conditions are represented by horizontal lines. The top two rows represent recognition in speech-shaped noise at the three SNRs indicated, and the bottom two rows represent recognition in multi-talker babble at three SNRs. Panels displaying scores following algorithm processing are immediately above those displaying scores following IBM processing. Hearing-impaired listeners are numbered and plotted in order of increasing pure-tone average (as in Fig. 1).

